


Australian Dollar, AUD/USD, Chinese Inflation, CPI, PPI – Talking Points
- Australian Dollar weakness unfazed on Chinese economic data
- Chinese inflation growth slows to 0.8% versus expected 1.0%
- AUD/USD breaks under 50-day SMA as weakness continues

The Australian Dollar was little changed versus the US Dollar after Chinese inflation, and factory gate prices for August crossed the wires. Chinese economic data often impacts the Aussie Dollar due to Australia’s high volume of trade with China. China’s consumer price index (CPI) rose 0.8% last month, missing the 1.0% consensus forecast. Factory gate prices, as measured by the producer price index (PPI), rose 9.5% in the same period, beating estimates calling for a 9.0% rise.
Chinese policymakers view the rapid rise in prices as a direct threat to economic growth. Covid induced supply bottlenecks, mining and farming disruptions, as well as port and railhead closures, pushed many commodity prices to or near record highs earlier this year. However, a resurgence in Covid cases, driven by the Delta variant, has dampened economic growth forecasts, resulting in some froth in prices coming off. That, in turn, helped alleviate pressure on Chinese policymakers, who took action earlier in the year to fight the skyward rise seen in commodities like iron ore and copper – both vital to China’s recovery.
Bets over whether Beijing will take action to offer the economy additional support fell earlier this week when China reported a better-than-expected trade balance. Today’s CPI print will likely help cool those bets further. The higher-than-expected PPI will likely keep Chinese regulators on their toes. Analysts are split on whether the People’s Bank of China (PBOC) may cut the Reserve Requirement Ratio (RRR) this month. Such a move would inject liquidity into China's financial system. The PBOC last cut the RRR in July.
The disparity in the growth trajectory between inflation and factory gate prices relative to their respective forecasts suggests that producers are holding off on passing down costs to consumers. This likely reflects a view that factories see their input costs as temporary and that they can absorb those higher prices within their profit margins.
The weakness in commodities and progress in the global vaccination campaign bodes well for the view that input prices will cool. While raw material prices have dropped when viewing a basket of commodities, including steel and agricultural products, the savings for factories is not immediate. That is because most producers secure prices through contracts months in advance typically. That said, if commodities remain suppressed, it is reasonable to assume factory gate prices will ease in the coming months. This may not bode well for the Australia Dollar as less stimulus in the Chinese economy may translate to weaker demand for Australian imports.

AUD/USD Technical Forecast
AUD/USD failed to make a directional shift on the Chinese data today. However, downside appears to be unfazed. The currency pair has been in a downtrend since earlier this week. A Bearish Engulfing Candlestick defined the beginning of the move lower. The 38.2% Fibonacci retracement from the August/September move may provide support. Below that is a trendline from July. RSI and MACD are both tracking lower, indicated downside momentum may continue. A recent break below the 50-day SMA also bodes poorly for the outlook.
AUD/USD 6-Hour Chart
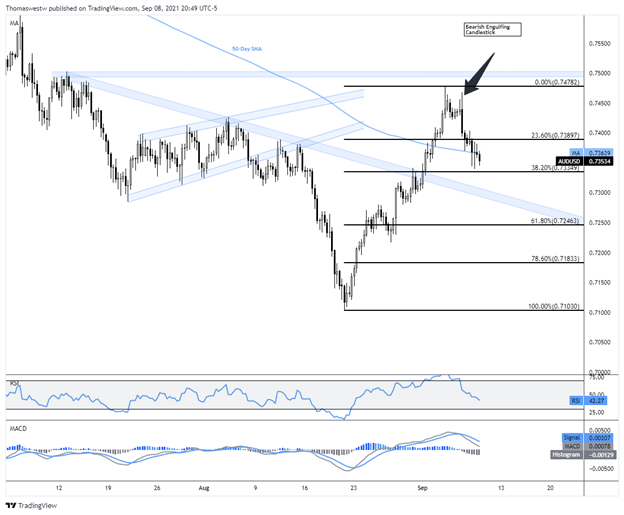
Chart created with TradingView
--- Written by Thomas Westwater, Analyst for DailyFX.com
To contact Thomas, use the comments section below or @FxWestwater on Twitter


