


2020 Election, S&P 500, Fiscal Stimulus Talks, Biden-Trump Spread - Talking Points
- Biden continues to lead Trump by significant margin – but what’s the catch?
- Fiscal stimulus talks are sending mixed signals as investors get whipsawed
- S&P 500 nearing all-time high at 3588.1 – will price action become timid?
21 DAYS UNTIL THE US PRESIDENTIAL ELECTION
It is officially less than three weeks until the 2020 election on November 3, with polls reinforcing the same narrative leading into the first presidential debate: Joe Biden will take the White House. RealClearPolitics betting odds show the former Vice President with the widest spread ever recorded between him and the incumbent President Donald Trump.
2020 US Election Polls
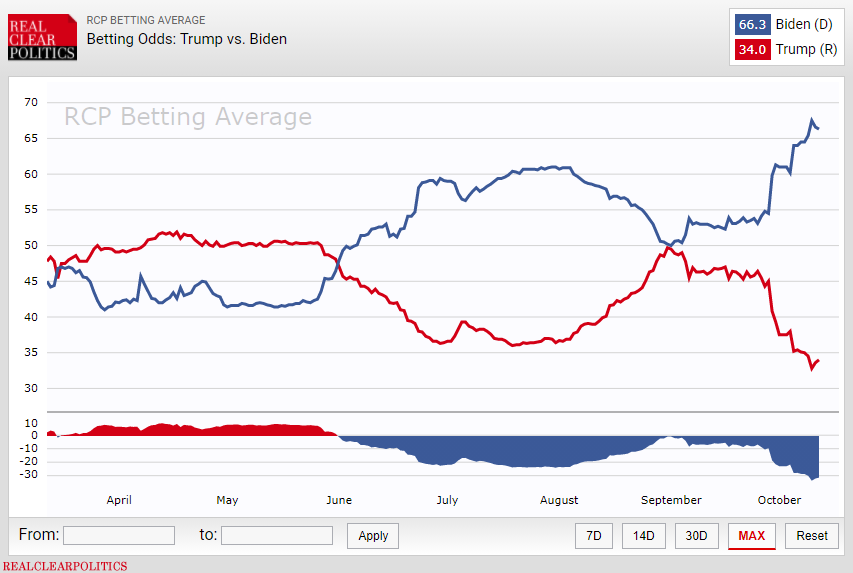
Mr. Biden’s lead over Trump was amplified after the first debate and was further strengthened after Mr. Trump contracted Covid-19 and was briefly hospitalized. Several of his aides have also tested positive for the coronavirus. With these developments, the public’s confidence in President Trump took a hit and by contrast cast Mr. Biden in a more favorable light. Having said all is, there is a catch.
Due to what statisticians call “differential partisan non-response” – a phenomenon by which a voter is less likely to answers a pollster’s call if their preferred candidate is doing poorly – polling data may be skewed. As a result, investors may be setting themselves up with a false sense of certainty, which if corrected and re-aligned with reality may stir markets and catalyze bouts of volatility.
Fiscal Talks Sending Mixed Signals'
Markets initially jumped at the start of the week over optimism about Congress passing another fiscal stimulus package before the November 3 deadline. However, conflicting messages from House Speaker Nancy Pelosi and Senate Majority Leader Mitch McConnell have caused equities to slightly wobble. Stocks spiked on news of progress, it is not outlandish to suggest that they could decline as quickly if lawmakers hit a wall again.
S&P 500 Analysis
The S&P 500 is climbing along a steep uptrend after it found a bottom in early October around 3197.5. The benchmark index is now approaching resistance at 3588.1 where it topped before spectacularly declining. Investors may start to become less bold as the index creeps closer to the key inflection point which will likely be reflected as increasingly-timid price action until it either breaks through it or capitulates.
S&P 500 - Daily Chart
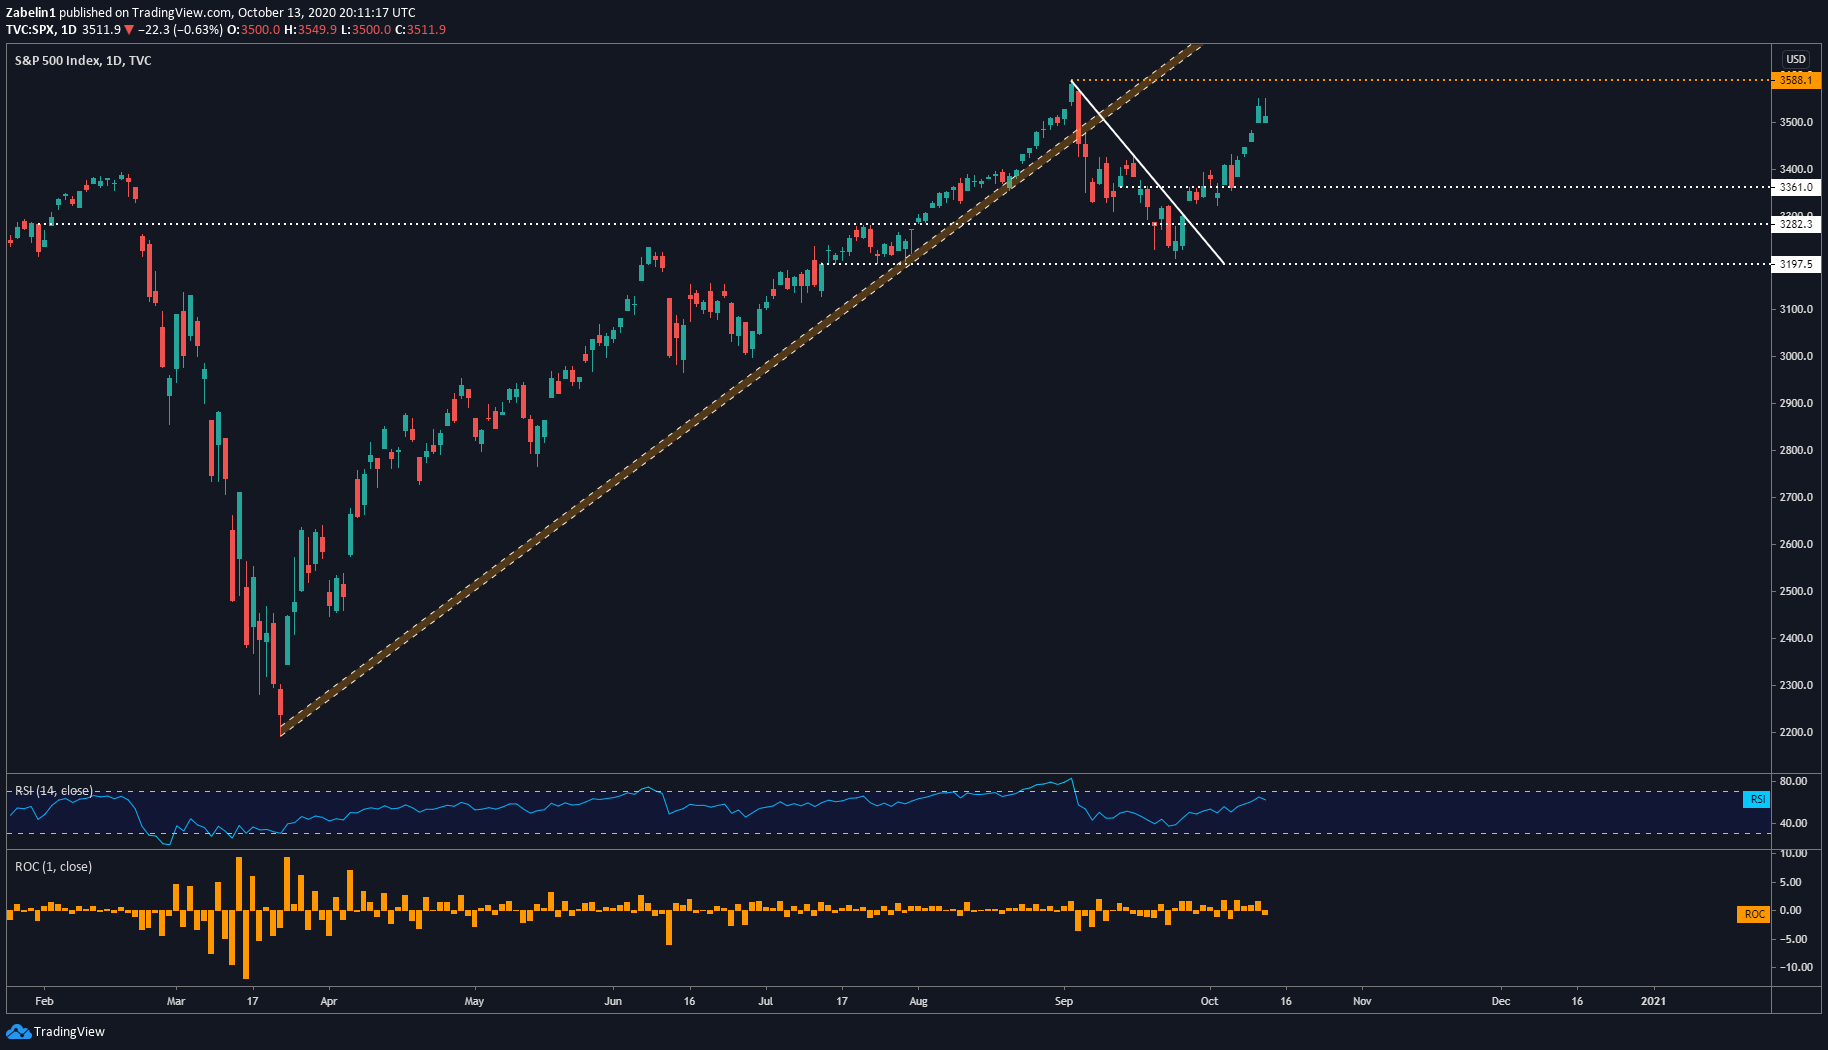
S&P 500 chart created using TradingView
--- Written by Dimitri Zabelin, Currency Analyst for DailyFX.com
To contact Dimitri, use the comments section below or @ZabelinDimitri on Twitter


