
US STOCKS OUTLOOK:
- S&P 500 and Nasdaq 100 finish the day modestly lower as tech stocks slide
- Nvidia’s revenue warning spook investors, prompting traders to cut risk exposure to semiconductors
- The July U.S. inflation report will steal the limelight on Wednesday
Trade Smarter - Sign up for the DailyFX Newsletter
Receive timely and compelling market commentary from the DailyFX team
Most Read: S&P 500, Nasdaq 100, Dow Jones: Grinding into Key Resistance
U.S. stocks began the week on the back foot, extending Friday’s subdued performance in a session characterized by higher-than-normal volatility. For context, the main equity benchmarks were posting strong gains in the early trade Monday, but then reversed their advance and took a turn to the downside as investors digested negative news from Nvidia, the 11th biggest company by market capitalization in America.
When it was all said and done, the S&P 500 inched down 0.12% to 4,140, with information technology and financials underperforming. The Nasdaq 100, for its part, declined 0.0.37% to 13,159, wiping out a rally of as much as 1.4%, dragged down by a 6.3% plunge in Nvidia shares.
Although a sharp decline in U.S. consumer inflation expectations across all time horizons in a survey produced by the Federal Reserve Bank of New York buoyed Wall Street sentiment initially, concerns about slowing activity ultimately outweighed positive data on the price front.

Fears about the health of the economy increased after Nvidia, one of the world's largest chipmakers, warned of a steep decline in sales in response to gaming weakness, indicating that quarterly revenue would fall about 19% sequentially to $6.7 billion in a preliminary financial results report, well below guidance of $8.1 billion.
Cooling demand for semiconductors, a highly cyclical space, suggests that gross domestic product continues to slow, undermined by softening consumption in the face of four-decade high inflation. While the outlook is incredibly challenging, the economy is not yet falling off the cliff and can still avoid a major downturn, thanks in part to the resilience of the U.S. labor market.
To avert a hard landing, the Fed may eventually have to pivot to a less aggressive monetary policy stance, but the timing of that scenario is still uncertain and largely depends on the evolution of consumer prices. We will get a better picture of the inflation profile Wednesday when the U.S. Bureau of Labor Statistics releases last month’s data.
July CPI is seen printing at 0.2% m-o-m following a 1.3% increase in June. With that result, the annual rate is expected to ease to 8.7% from 9.1% previously, a welcome directional improvement, but still an extremely high number, more than four times above the central bank's 2% target. In any case, the lower the CPI figures, the better for sentiment and stocks, especially those in the tech and growth space.
| Change in | Longs | Shorts | OI |
| Daily | 1% | -1% | 0% |
| Weekly | 15% | -13% | -1% |
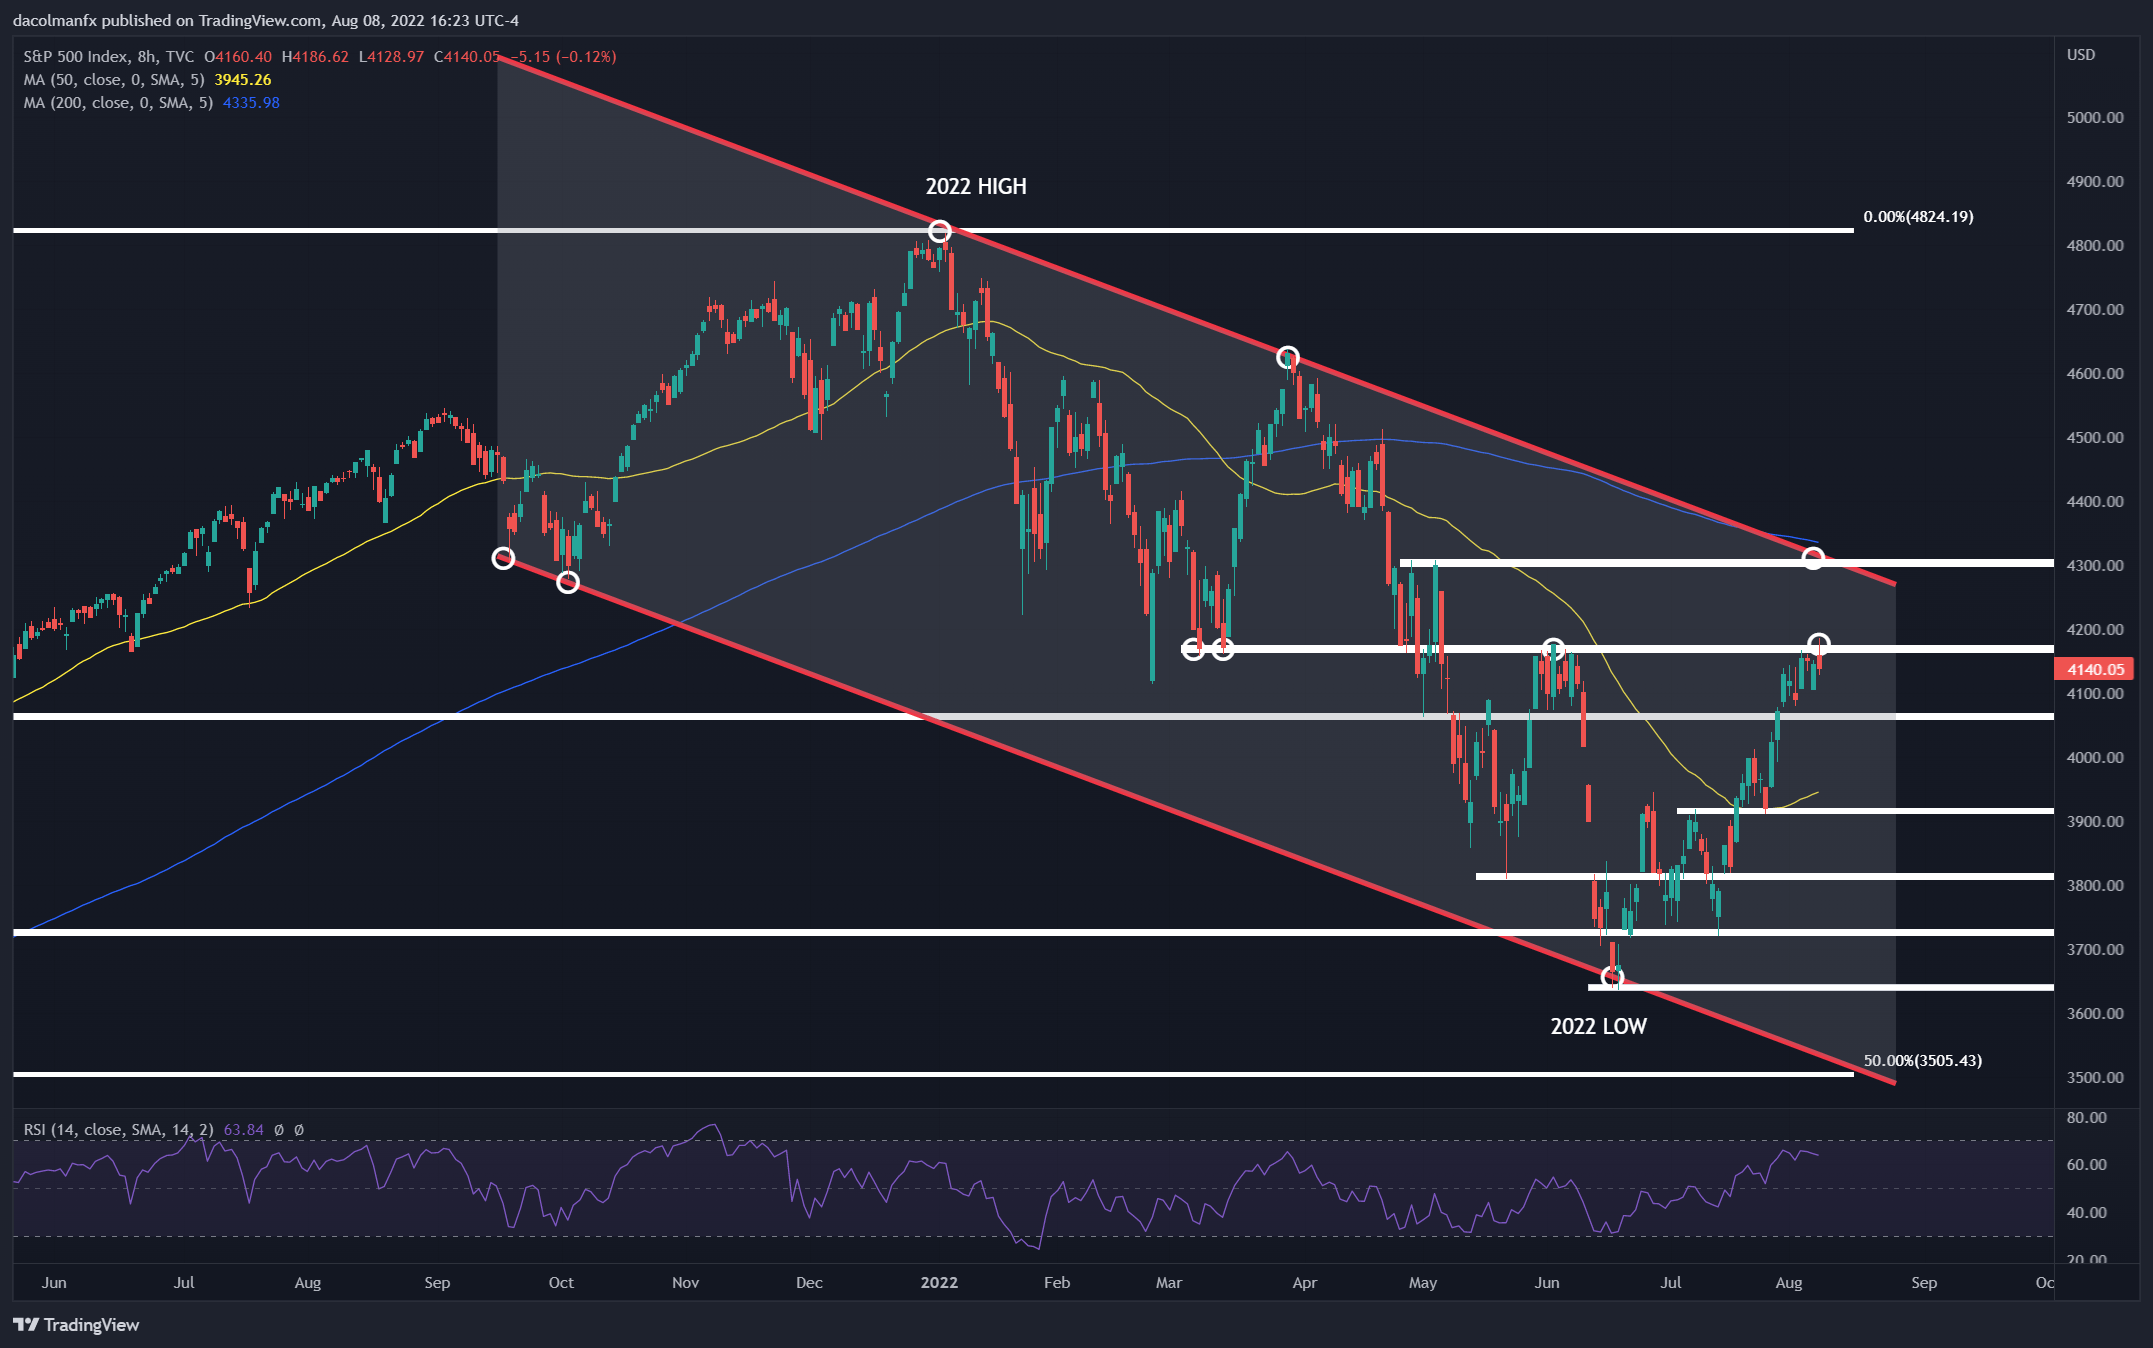
S&P 500 TECHNICAL ANALYSIS
The S&P 500 has been stuck around key resistance (4,160-4,175) over the past few days as the tug-of-war between the bears and bulls remains unresolved. Traders should keep a close eye on this technical area in the coming days, as price reaction may provide clues as to near-term direction.
In terms of possible scenarios, if we see a decisive break above 4,160-4,175, bullish momentum could resume, setting the stage for a rally towards channel resistance at 4,300. On the flip side, if sellers regain control of the market and spark a strong bearish reversal from current levels, initial support appears at 4,065. On further weakness, the focus shifts to 3,920.
S&P 500 TECHNICAL CHART