
US STOCKS OUTLOOK:
- S&P 500 rises 0.95% to 3,795, but remains trapped in bear market territory
- Despite the late day rally, sentiment is fragile amid signs that the U.S. economy is decelerating rapidly and aggressively
- End of quarter rebalancing activity may support equities in the coming days, but gains could be short-lived amid heightened uncertainty.
Trade Smarter - Sign up for the DailyFX Newsletter
Receive timely and compelling market commentary from the DailyFX team
Most Read: Gamma Squeeze Explained - Basic Options Theory and How it Works
After a subdued performance for most of the day, U.S. stocks managed to stage a surprise late day rally, with the S&P 500 rising 0.95% to 3,795, supported by moderate strength in the technology sector. Although the equity index came close to breaking out of bear market territory, it was unable to do so, as buying pressure was insufficient to push prices above the 3,800 area decisively. Despite today's advance, there is no reason to be particularly bullish at this point, as the outlook remains bleak for risk assets on growing signs of trouble for the economy.
Wall Street angst increased after U.S. macro data showed a sharp slowdown in economic activity at the tail end of the second quarter, raising the possibility of a further contraction in gross domestic product in that period. For context, the S&P Global Flash Composite PMI, which tracks business trends across both the manufacturing and service sectors, dropped to a five-month low of 51.2 in June, barely managing to stay in expansionary terrain amid a slump in demand.
With sentiment dominated by worries of a downturn, U.S. Treasury yields have started to come down across the curve from their recent highs on bets the Fed will blink at some point and reverse course once economic carnage becomes unbearable.

So far, there is no indication that the U.S. central bank will pivot and slow its tightening cycle despite the many headwinds ahead. On the contrary, Fed Chairman Powell has doubled down on hawkish rhetoric during his congressional testimony this week, indicating that policymakers have an unconditional commitment and the resolve to restore price stability, a signal that the bank will do whatever it takes to tame inflation.
Focusing on upcoming potential catalysts, the U.S. economic calendar will be light on Friday, but there will be several high-impact events next week, including the release of durable goods orders, June consumer confidence and May PCE data.
As the second quarter draws to a close, funds rebalancing, a practice that involves readjusting a portfolio's weightings by buying or selling assets to return allocation percentages to predefined levels, may spur equity-buying activity and fuel a late-month rally on Wall Street. Any gains, however, could be transitory amid a reduced appetite for holding risk ahead of the next earnings season, when companies could begin to issue negative profit warnings and slash their outlook.
| Change in | Longs | Shorts | OI |
| Daily | 1% | -1% | 0% |
| Weekly | 15% | -13% | -1% |
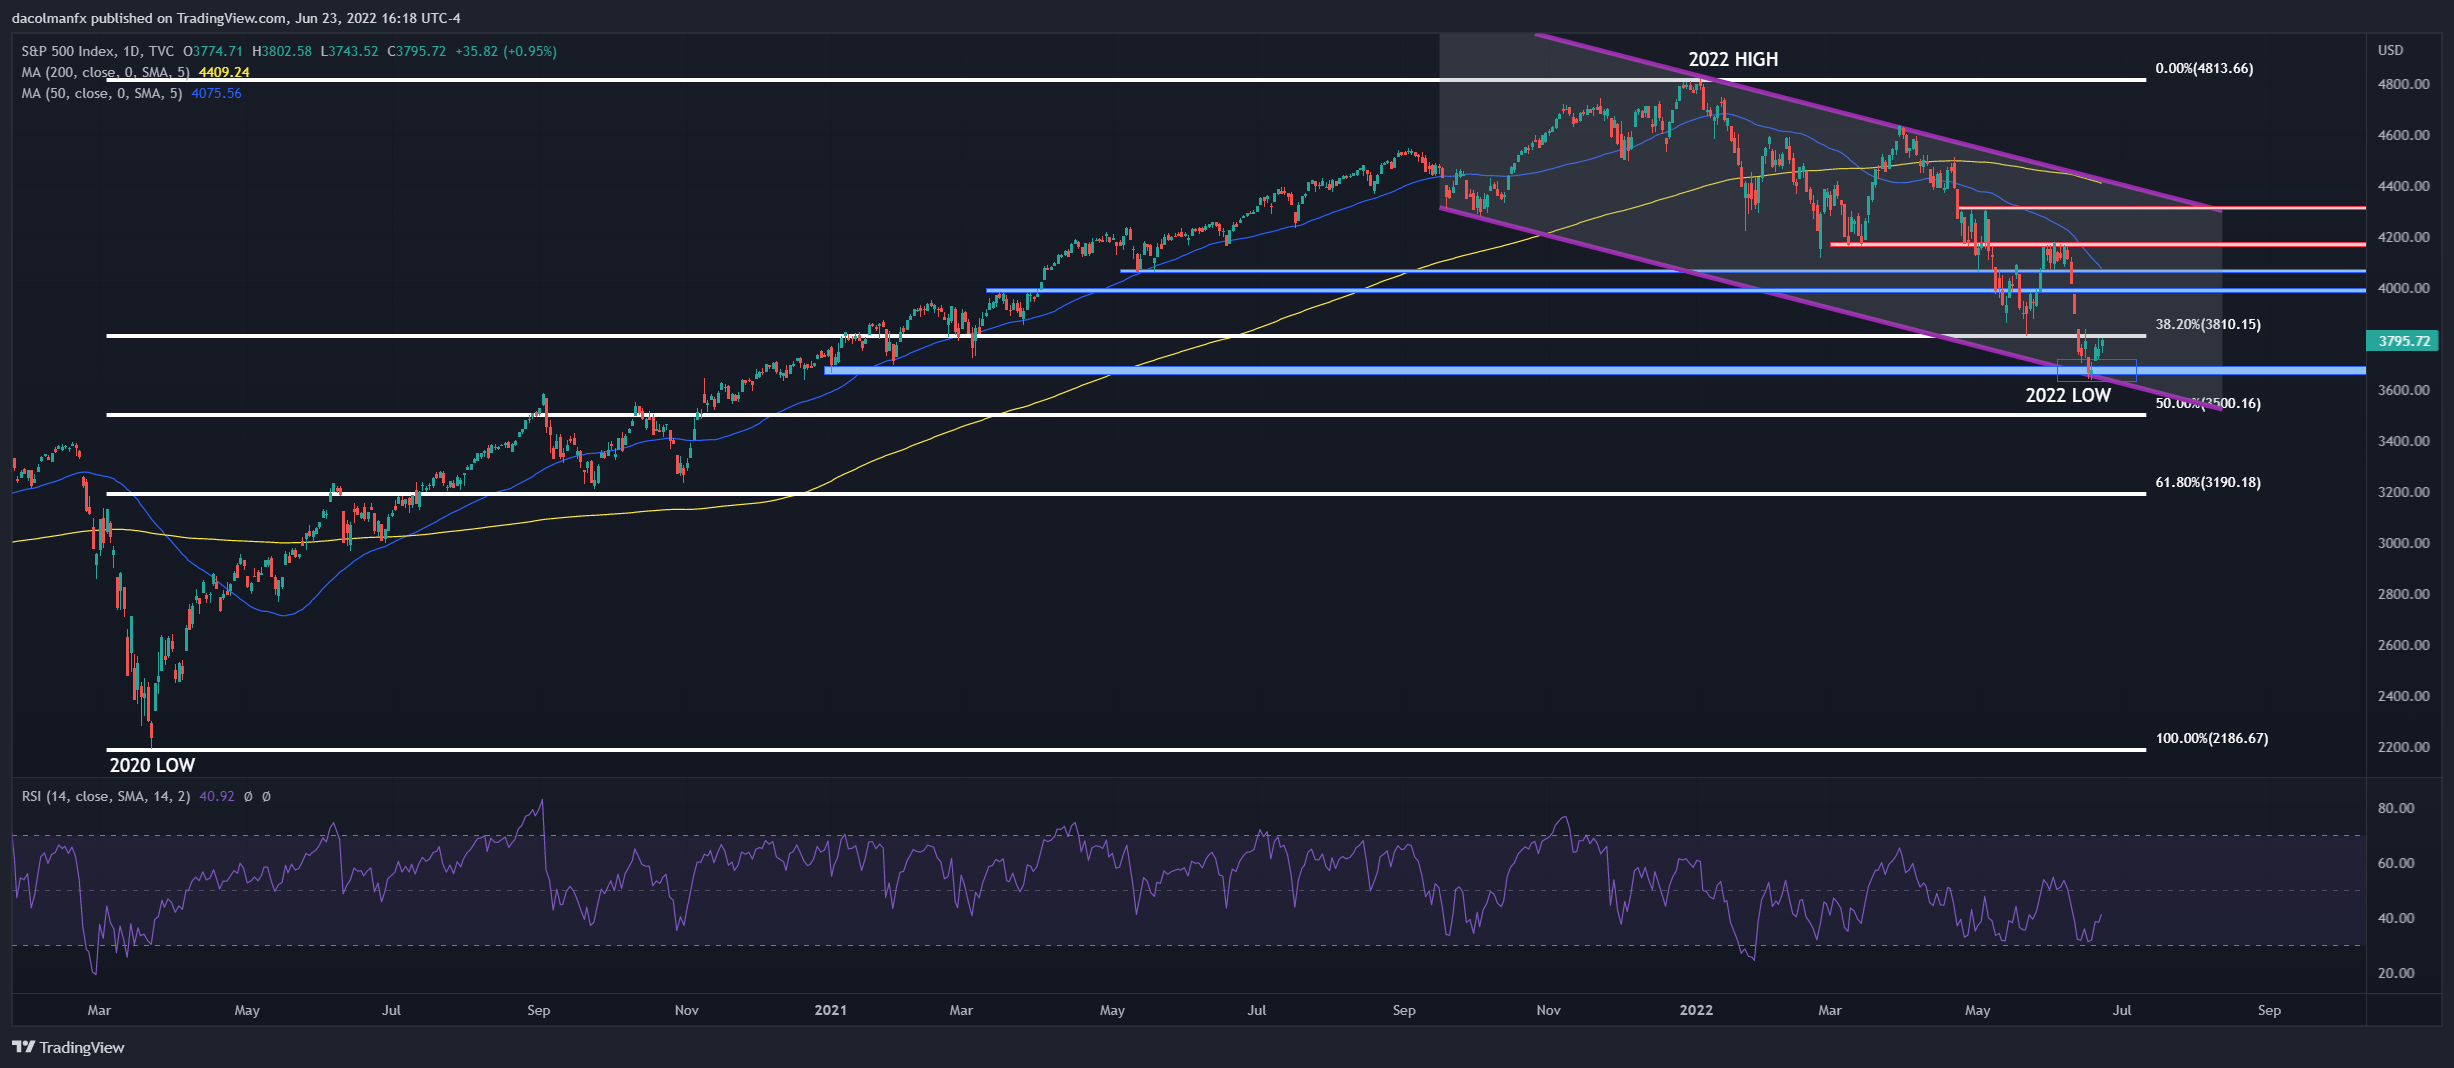
S&P 500 TECHNICAL ANALYSIS
The S&P 500 sank aggressively last week and set a fresh low for the year, but failed to breach technical support stretching from 3,700 to 3,665. If this floor holds and prices continue their slow trek upwards, bulls may be emboldened to jump back in, but to have confidence that the worst is over, we need to see a clear break above 3,810, followed by a move atop 4,000.
On the other hand, if sellers regain control of the market and push the index below 3,700/3,665, all bets are off. Under this scenario, downside pressure could strengthen, paving the way for a slide towards the 3,500 area, a pivotal support created by the 50% Fibonacci retracement of the 2020/2022 rally.
S&P 500 TECHNICAL CHART