
Indian Rupee, USD/INR, Nifty 50, US Dollar, India, Coronavirus - Talking Points
- Indian Rupee, Nifty 50 gain with broad upbeat market tone
- Risks brewing in the background: India GDP, credit rating
- USD/INR remains in consolidation, Nifty pressures resistance
The Indian Rupee has benefited from declines against the US Dollar, though not quite to the same extent against neighboring ASEAN-oriented currencies such as SGD, IDR, MYR and PHP. These are often sensitive to developments in general global market sentiment, which has been recovering since late March. India’s benchmark stock index – the Nifty 50 – has participated in this recovery as the Rupee gained.

Last week, my Wall Street index avoided a downside technical breakout, setting the stage for the rally in stocks on Monday – as expected. Investors are appearing to shrug off local and external unrest for the time being, looking forward to the economic recovery from an easing in social distancing measures. India is also appearing to head in the same direction, with lockdowns readying to be eased in phases starting next week.
Still, Moody’s just recently cut India’s sovereign credit rating to ‘Baa3’ from ‘Baa2’ with a negative outlook. That is the lowest investment grade assessment from the ratings agency. That may have helped to explain why the US Dollar fared slightly better against INR than some of its ASEAN counterparts. It may also undermine last week’s beat in local first-quarter GDP data.
Indian growth slowed to 3.1% y/y from a revised-lower 4.1% in Q4. Granted, this largely beat economists’ more-pessimistic 1.6% estimate. Keep in mind that the nation went into lockdown towards the end of Q1. Economists surveyed by Bloomberg anticipated fiscal-year 2021 real GDP to shrink -1.9% y/y. That would be the steepest slump in over 40 years and could in the long run weigh against the Indian Rupee.
Indian Rupee Technical Analysis
From a technical standpoint, USD/INR remains in a fairly narrow congestive range since the middle of April. Prices have been oscillating between outer resistance (76.24) and outer support (74.96). A rising trend line from April – red line – seems to be guiding the pair slightly higher.
Still, closing under it may not necessarily pave the way for a downside breakout until prices fall through 74.96 with confirmation. The latter exposes former highs from 2018. Otherwise, clearing resistance may pave the way for retesting the April peak at 77.
USD/INR Daily Chart

USD/INR Chart Created in TradingView
Nifty 50 Technical Analysis
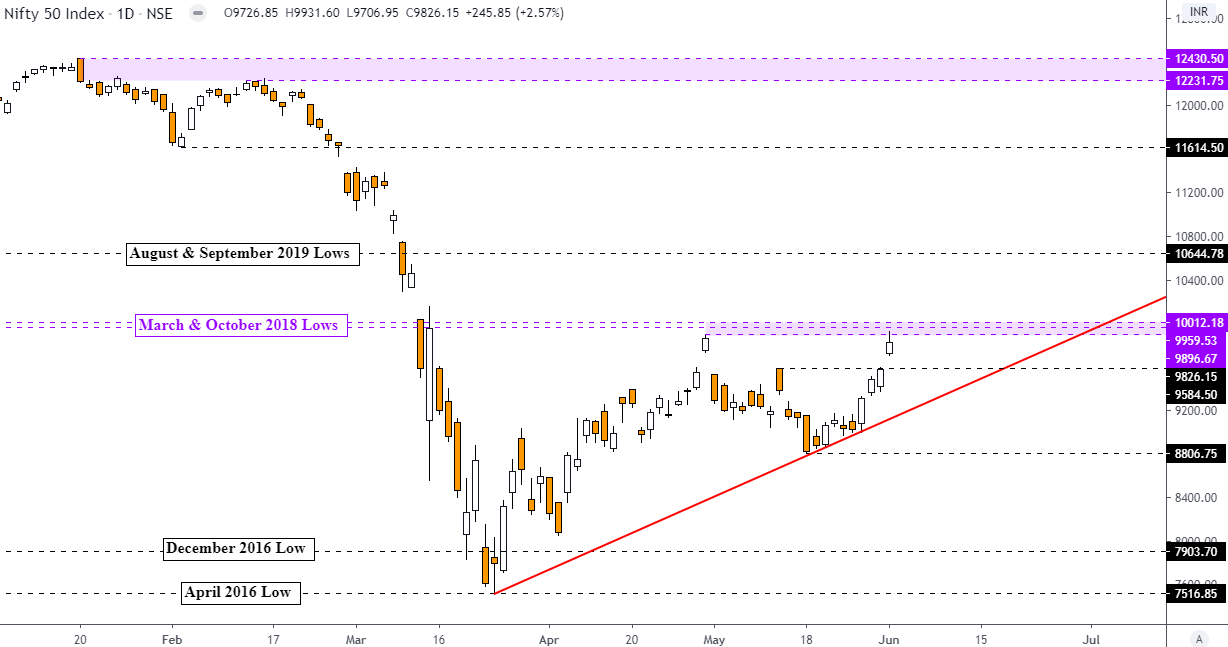
Recent gains in the Nifty 50 have left India’s benchmark stock index pressuring critical resistance which is a range between 9896 – 10012. This area consists of lows from March and October of 2018. This range was rejected in late April as prices then fell and established a rising trend line from March – red line.
If resistance holds here, the Nifty could turn lower to retest rising support. Closing under the line would then expose the May low at 8806. Otherwise, clearing resistance may open the door to revisiting lows from the latter-half of 2019.
Nifty 50 Daily Chart
Nifty 50 Chart Created in TradingView
--- Written by Daniel Dubrovsky, Currency Analyst for DailyFX.com
To contact Daniel, use the comments section below or @ddubrovskyFX on Twitter