


BRITISH POUND KEY POINTS:
- U.S dollar falls across the board as bond yields retreat from multi-year highs
- GBP/USD bounces off support in the 1.3000/1.2980 region, but its outlook remains negative
- Turning to technical analysis, the development of a descending triangle pattern on the daily chart portends further weakness for base currency
Trade Smarter - Sign up for the DailyFX Newsletter
Receive timely and compelling market commentary from the DailyFX team
Most read: US Dollar Pullback Begins -EUR/USD, GBP/USD & USD/JPY Key Levels
The overbought U.S. dollar retreated on Wednesday, pressured by falling bond rates across most of the U.S. Treasury curve. The 10-year yield, for instance, came down from multi-year highs, dropping to 2.86% from 2.98% set in the overnight session. In this context, G-10 currencies appreciated across the board against the greenback, with the euro, the yen, the pound all posting decent gains on an intraday basis. In this article, however, GBP/USD will be the focus of analysis.
At the time of writing, cable is up 0.43% to 1.3055, a modest advance after a rebound from technical support at 1.3000/1.2980. Although sterling bulls are welcoming the recovery, there is little cause for optimism at the moment, especially as the UK economy faces mounting headwinds due to the ongoing war in Ukraine. The first risk to consider stems from the rapid slowdown in economic output. For context, in January, the International Monetary Fund expected UK gross domestic product to expand by 4.7% in 2022 and 2.3% in 2023, but those projections are no longer valid. Now, the IMF sees the country growing by only 3.7% this year and a paltry 1.2% next year.

The deteriorating outlook for activity is perhaps one reason why traders aren’t pricing in more aggressive monetary normalization despite inflation standing at 7%, its highest level in 30 years. While the Fed is seen front-loading hikes expeditiously and raising borrowing costs in 50 bps increments at its May, June and possibly July meeting, the market is only discounting roughly 40 bps of tightening by the Bank of England over the next three months. This divergence in policy actions and the wide yield differential in favor of the United States is likely to keep the British pound subdued over the medium term.
In terms of technical analysis, GBP/USD is clearly biased to the downside, with price trading below key moving averages and lower highs and lower lows firmly in place. Another reason for caution is the development of a descending triangle on the daily chart, a bearish formation that usually emerges during a downtrend and tends to presage further weakness in the underlying asset. In this case, the base of the triangle, whose breakout could confirm the pattern, lies at 1.3000/1.2980. This floor must hold, otherwise the selling pressure could intensify, paving the way for a move towards 1.2840 and, in the worst-case scenario, 1.2660.
On the flip side, if GBP/USD defies expectations and extends the recent bounce, initial resistance appears at 1.3090, the triangle descending trendline. If the pair manages to clear this hurdle decisively, buyers could launch on attack on the 1.3200 psychological level. On further strength, the focus shifts up to the 50-day moving average, followed by 1.3365.
GBP/USD TECHNICAL CHART
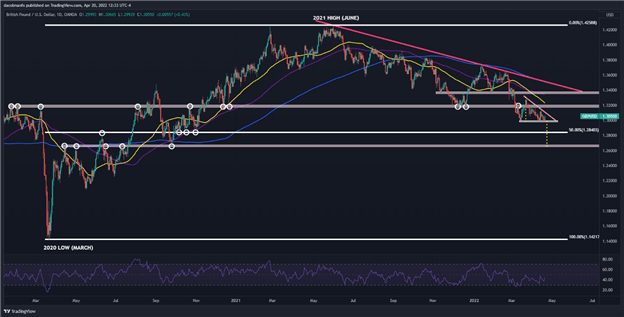
GBP/USD chart prepared using TradingView
EDUCATION TOOLS FOR TRADERS
- Are you just getting started? Download the beginners’ guide for FX traders
- Would you like to know more about your trading personality? Take the DailyFX quiz and find out
- IG's client positioning data provides valuable information on market sentiment. Get your free guide on how to use this powerful trading indicator here.
---Written by Diego Colman, Contributor


