


S&P 500 OUTLOOK:
- U.S. CPI rises at the fastest face since 1982 and hits 7% y/y in December, but fails to spark a negative reaction in risk assets
- Mounting inflationary pressures, however, can pave the way for aggressive monetary tightening, setting the stage for S&P 500 weakness in the short-term
- Market attention will now turn to the official start of the earnings season, with big banks due to kick-off the cycle on Friday
Trade Smarter - Sign up for the DailyFX Newsletter
Receive timely and compelling market commentary from the DailyFX team
Most read: Everything You Need to Know About Types of Stocks
U.S. stocks advanced on Wednesday, but the strong recovery momentum seen on Tuesday took a breather amid investor caution on mounting inflationary forces in the economy. At the market close, the S&P 500 climbed 0.28% to 4,726, but finished the day off its highs as risk appetite slowly dwindled throughout the trading session. The Nasdaq 100 also rose, clambering 0.38% to 15,905. Elsewhere, the Dow Jones underperformed its peers, eking out a 0.11% gain to end the day at 36,290.
Key data released in the morning showed December headline CPI increasing at the fastest pace since 1982, up 7% y/y from November’s 6.8% y/y. The core gauge, which excludes volatile food and energy components, also accelerated, rising from 4.9% y/y to 5.5% y/y, the hottest reading since 1991. Initially, the consumer price index report triggered a knee-jerk reaction to the upside among risk-assets, but the move faded over the hours as Wall Street began to digest the alarming results and their potential ramifications for monetary policy.

Broadening inflationary pressures, especially in sticky components such as shelter, should reinforce bets that the Fed will act quickly and aggressively to withdraw support in the current normalization process. We probably didn’t see that kind of repricing today because investors had front-run the FOMC in recent weeks, driving Treasury prices lower and yields significantly higher already. For instance, the 10-year yield has risen more than 22 bps and the 2-year almost 18 bps in less than 10 trading days. However, after a pause and some consolidation, rates may begin move up again soon, weighing on stocks with lofty valuations in the growth and tech space. In this environment, the Nasdaq 100 and S&P 500 will struggle and should underperform value-leaning indices such as the Dow Jones.
Focusing on other near-term catalysts, the fourth quarter earnings cycle will take center stage in the coming days. Financial heavyweights will kick off the season in earnest towards the end of the week, with JPMorgan (JPM), Wells Fargo (WFC), Citigroup (C), BlackRock (BLK) and First Republic (FRC) all announcing results on Friday before the opening bell. Banks are a bellwether for the economy, so traders should pay particular attention to forward guidance relating to loan activity and net interest margins against a backdrop of rising rates. If they sound bullish on those two key metrics, financials can continue to command strength over the medium term, lifting other cyclical proxies in their slipstream.
Below is a summary of Friday's main corporate results to keep an eye on
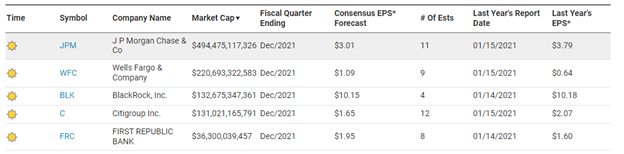
Source: Nasdaq

S&P 500 TECHNICAL ANALYSIS
After Tuesday’s strong rally, follow-through buying momentum weakened on Wednesday, preventing the S&P 500 from clearing technical resistance at 4,750. If the index fails to breach this barrier decisively in the coming sessions, bearish pressure could begin to build, paving the way for a move towards trendline support near the 4,600 psychological area. On the other hand, if bulls retake resolute control of the market and push the price above 4,750 decisively, the S&P 500 could be on track to reclaim its all-time at 4,818.
S&P 500 Daily Chart
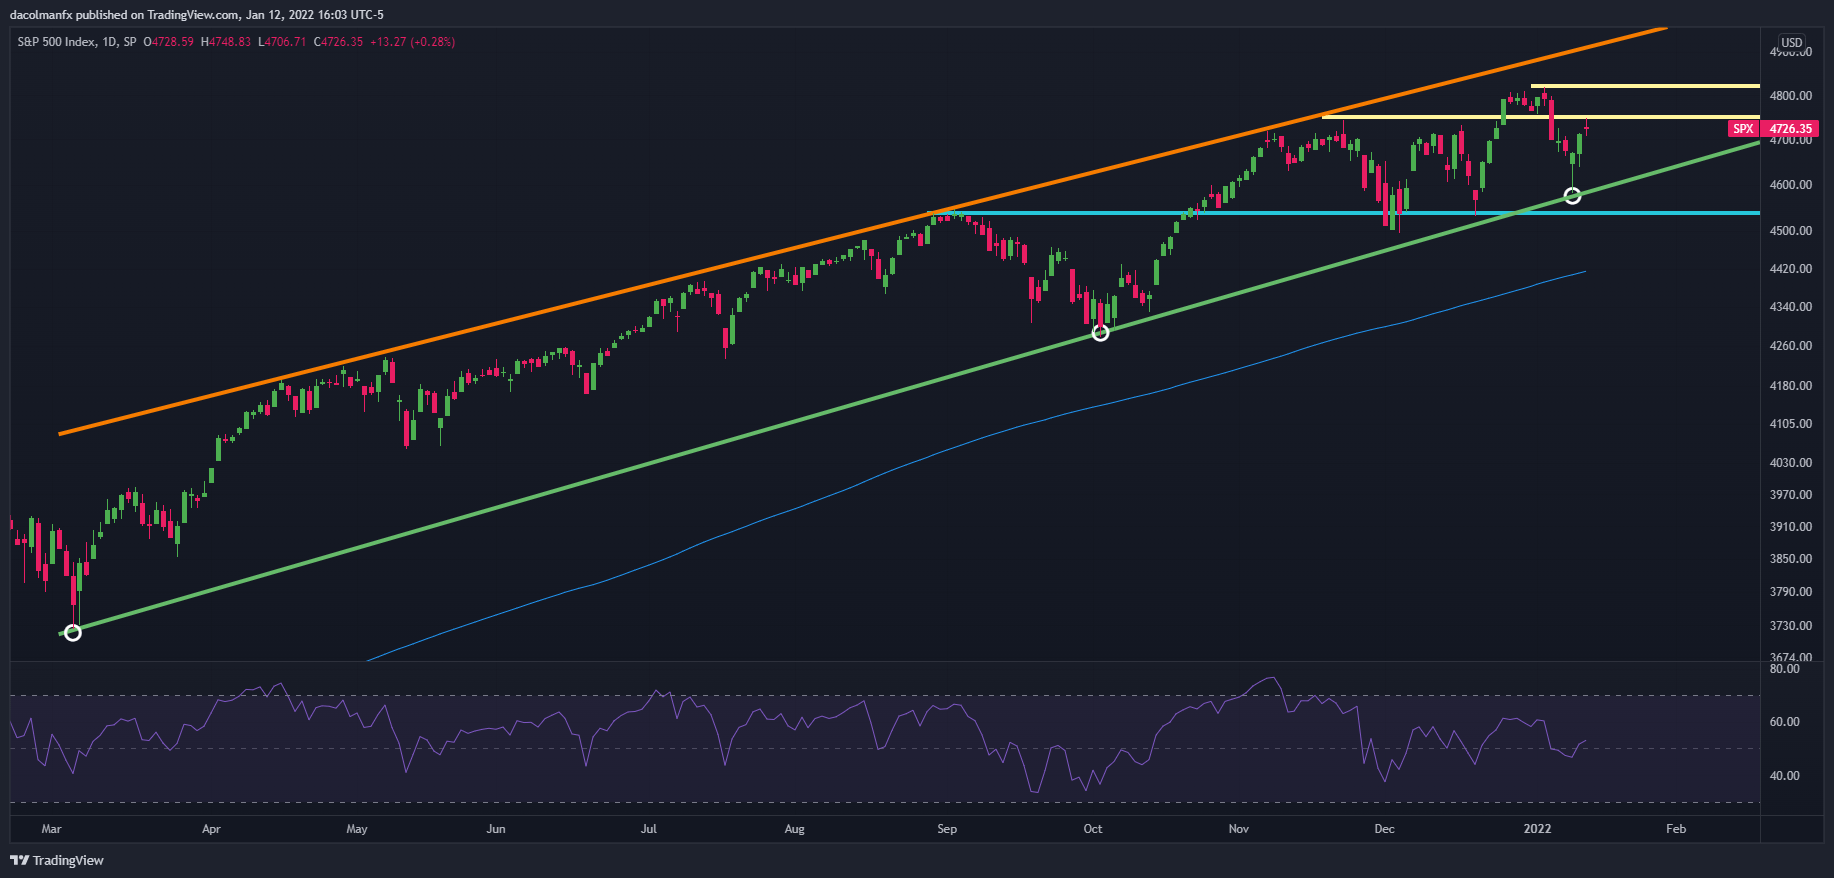
S&P 500 (SPX) Chart by TradingView
| Change in | Longs | Shorts | OI |
| Daily | 1% | -1% | 0% |
| Weekly | 15% | -13% | -1% |
EDUCATION TOOLS FOR TRADERS
- Are you just getting started? Download the beginners’ guide for FX traders
- Would you like to know more about your trading personality? Take the DailyFX quiz and find out
- IG's client positioning data provides valuable information on market sentiment. Get your free guide on how to use this powerful trading indicator here.
---Written by Diego Colman, Contributor


