


U.S. STOCKS OUTLOOK:
- The three major US stock indexes end the session higher and set a record close
- Strong corporate earnings and bullish sentiment amid FOMO sentiment outweigh concerns about monetary tightening, lifting risk assets ahead of the Fed decision
- On Wednesday, the FOMC will release its November monetary policy decision. No change in rates is expected, but the central bank is seen announcing a plan to reduce asset purchases
Trade Smarter - Sign up for the DailyFX Newsletter
Receive timely and compelling market commentary from the DailyFX team
Most read: November Seasonally Points to Gold Weakness and Stocks Momentum
U.S. stocks edged higher on Tuesday supported by strong corporate earnings and FOMO sentiment, although gains were somewhat moderate as investors remained cautious ahead of Wednesday's Federal Reserve policy announcement. Despite the measured moves on Wall Street, the S&P 500 and Nasdaq 100 managed to eke out a record close, with the former rising 0.37% to 4,631 and the latter up 0.42% to 15,972. Meanwhile, the Dow Jones Industrial Average also notched an all-time high, climbing 0.39% to end the session at 36,053.
Focusing on the Fed, the institution will unveil its November monetary policy decision tomorrow at 14:00 ET. No change in borrowing costs is expected, although the rate-setting committee is expected to officially announce a plan to begin tapering asset purchases, as the economy has already met the conditions for gradual removal of accommodation (monthly reduction of $10 billion in Treasuries and $5 billion in MBS is the baseline scenario).
The move to begin tapering the $120 billion monthly bond-buying program has been extensively telegraphed by policymakers and is widely discounted, so it should not be a major source of turbulence in and of itself. However, the tone adopted by the central bank in the statement and in the post-meeting press conference may trigger volatility if it is perceived as hawkish. At the moment, the stars seem to be aligning for that scenario.

Traders have been pricing in faster normalization in recent weeks as inflationary pressures and supply chain issues have become more prevalent, boosting bets for higher rates ahead of central banks' own plans, with Eurodollar futures already pointing to a June 2022 hike.The Fed is unlikely to push back against expectations for tighter monetary policy to preserve flexibility and optionality should the inflation outlook worsen. If that were the case, the central bank could respond quickly and pivot toward liftoff without disrupting markets.
All things considered, the failure to reject market pricing may be viewed as a marginally hawkish outcome, so it could potentially trigger a bearish reaction in equities, pulling the major stock indices down from this week’s all-time highs. Any sell-off, however, is likely to be shallow and short-lived, as strong corporate earnings, constructive profit guidance, seasonality and bullish sentiment remain supportive of risk assets into year-end.
| Change in | Longs | Shorts | OI |
| Daily | -18% | 18% | 7% |
| Weekly | -19% | 14% | 4% |
DOW JONES TECHNICAL ANALYSIS
Early last month, I discusseda bullish double bottom configuration on the Dow Jones’ daily chart. The technical formation was confirmed a few weeks ago, triggering a strong rally. Since then, the Dow has risen more than 3%, although it has yet to reach the upside target set by the pattern, which stands at ~36,3400. This means that the blue-chip index may still have gas in the tank to charge higher, however, gains may not follow a straight line as price continues to approach channel resistance and the market leans towards overbought territory. That said, if we see a pullback, price could retreat towards support at 35,500 before resuming its uptrend, although a drop below that floor could create vulnerabilities and expose the 35,000 area.
DOW JONES TECHNICAL CHART
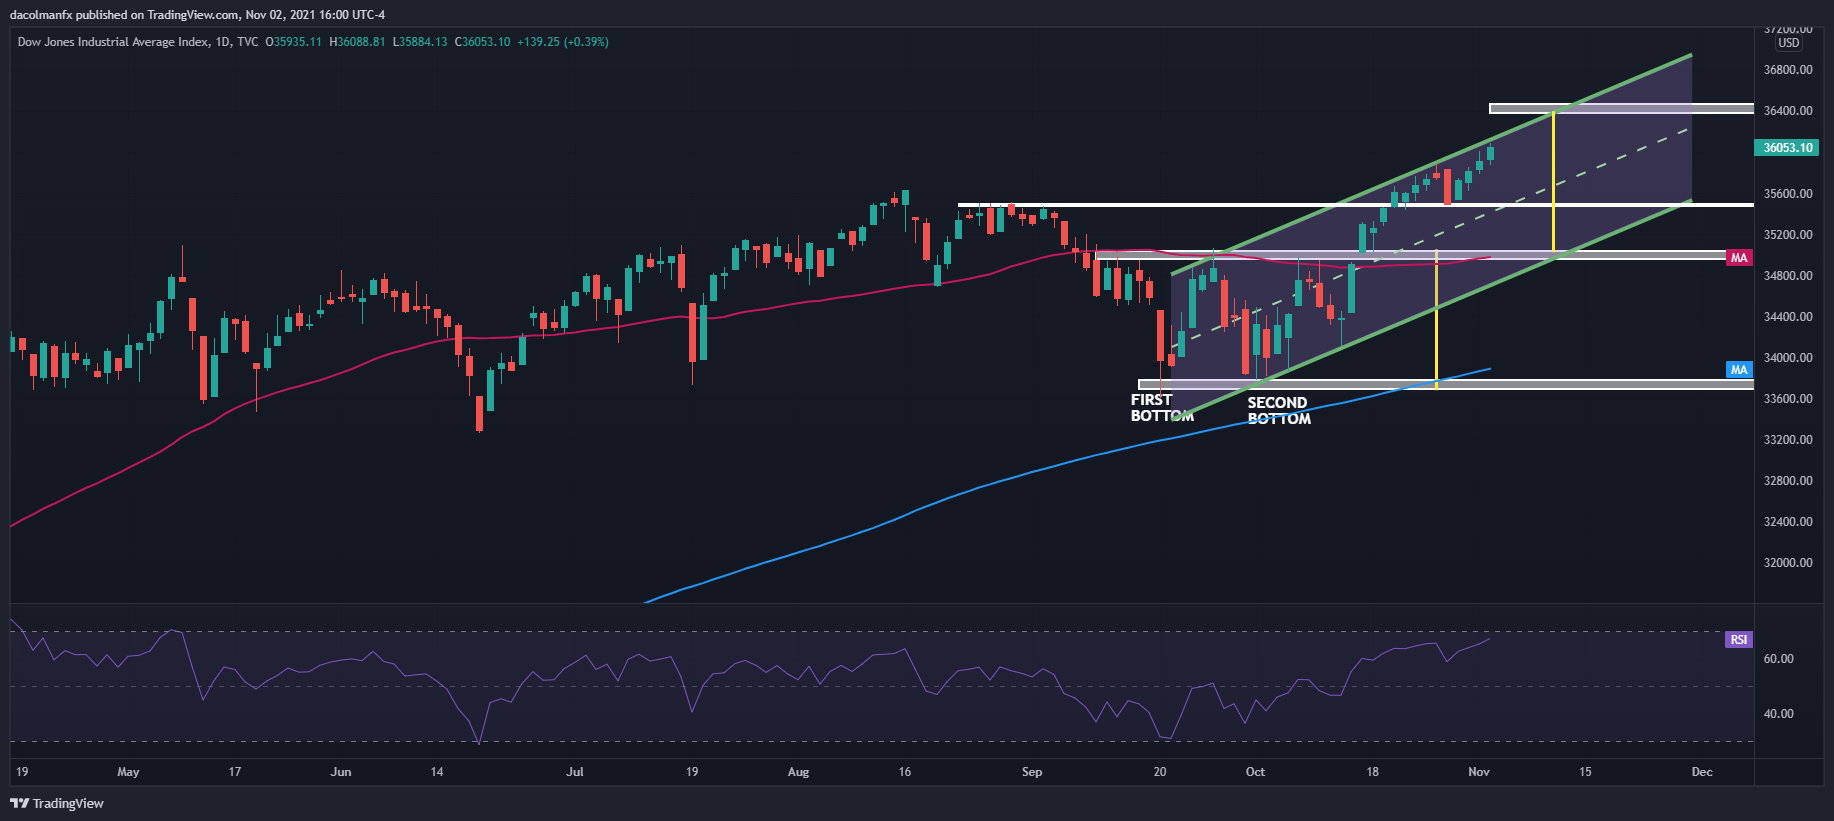
Source: TradingView
EDUCATION TOOLS FOR TRADERS
- Are you just getting started? Download the beginners’ guide for FX traders
- Would you like to know more about your trading personality? Take the DailyFX quiz and find out
- IG's client positioning data provides valuable information on market sentiment. Get your free guide on how to use this powerful trading indicator here.
---Written by Diego Colman, Contributor


