


RAND ANALYSIS
- Local elections see investors flee South African Rand.
- USD/ZAR tests March 2021 highs.
- Clean symmetrical triangle breakout.
ZAR FUNDAMENTAL BACKDROP
Today’s public holiday set aside for municipal elections in South Africa has created somewhat of a rand sell-off against the dollar. Although the Dollar Index (DXY) is down during today’s trading session, uncertainty around election day is clearly drawing away from any rand appeal. South African linked export commodities are a mixed bag so no directional bias favoring USD/ZAR upside. The South African 10-year government bond yield (see chart below) reflects what’s developing within the currency space as bond outflows continue causing the spike in yields.
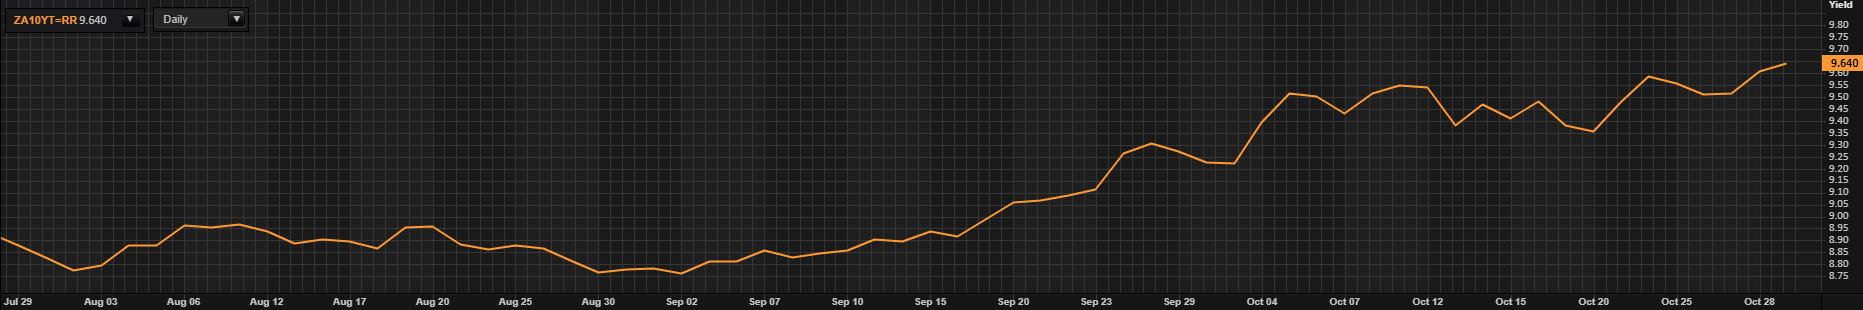
Source: Refinitiv
Expectations around QE tapering on Wednesday may be exacerbating the rand weakness but looking across the major ZAR gauges (USD, GBP and EUR), it is clear that South African political improbability is the primary influence for today.
Tomorrow, markets can look forward to South African Manufacturing PMI data (refer to calendar below) which may add to further rand depreciation should actual numbers come in below estimates. Manufacturing PMI represents the state of conditions within the manufacturing sector and a reading above 50 lends itself to an expanding manufacturing sector and vice versa for a print below 50. On Thursday the Medium-Term Budget Policy Statement (MTBPS) will also give some forward guidance as to the approach government will take to tackle the many challenges it currently faces.
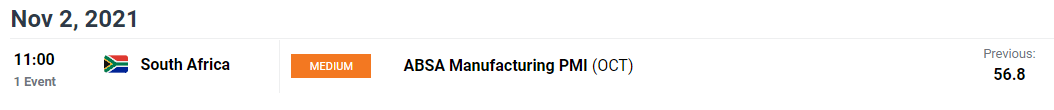
Source: DailyFX economic calendar

TECHNICAL ANALYSIS
USD/ZAR DAILY CHART
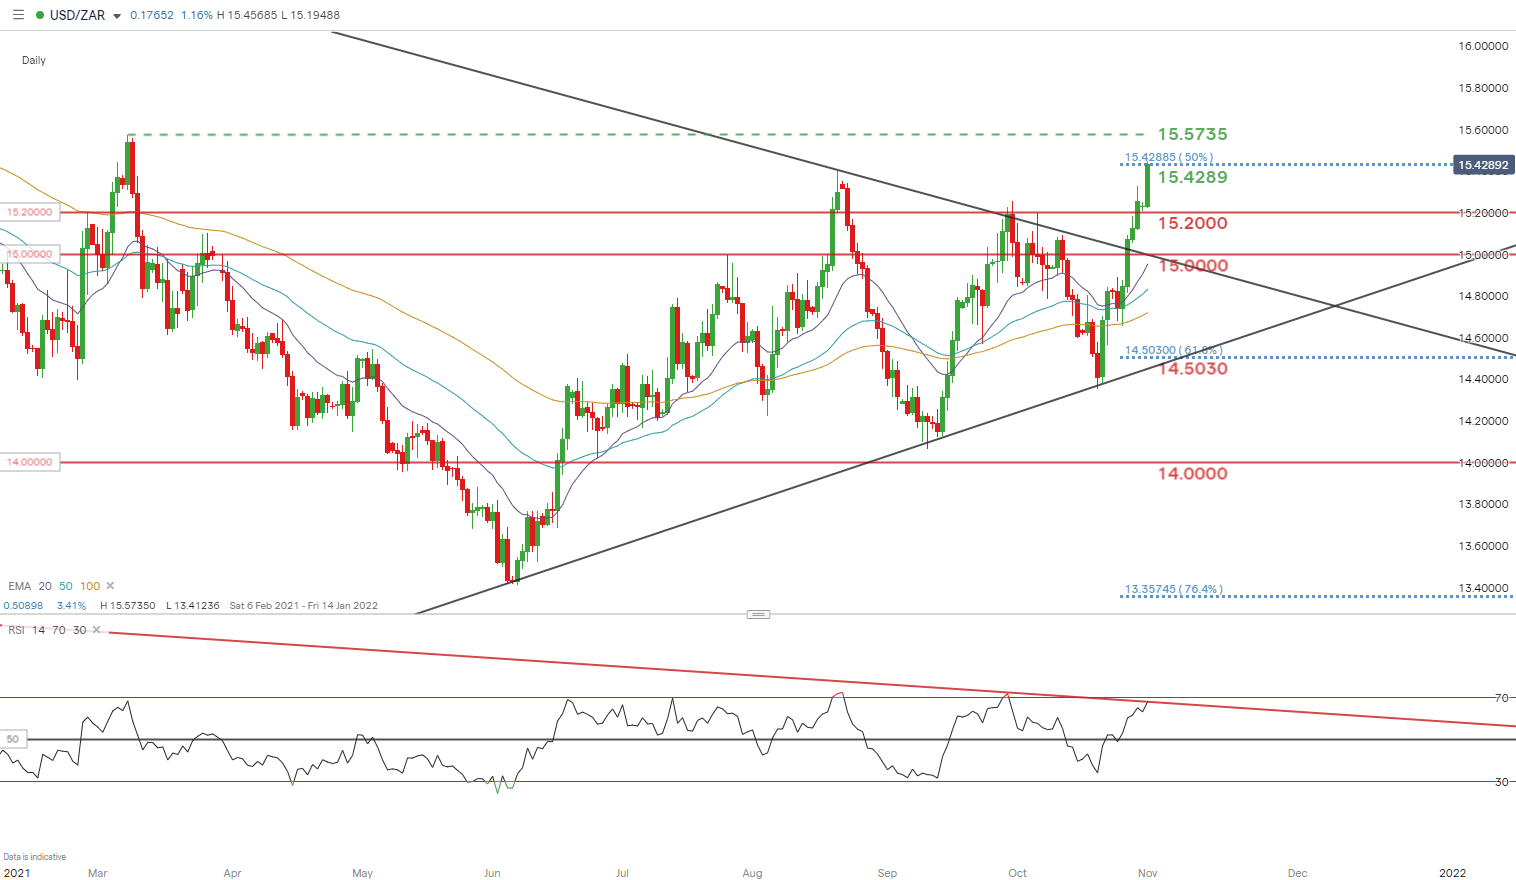
Chart prepared by Warren Venketas, IG
I have been talking up the medium-term symmetrical triangle for some time now, and from the USD/ZAR daily chart above it has been confirmed last week and continues to push towards the 50% Fibonacci 15.4289 horizontal resistance zone (Fibonacci taken from February 2018 low to April 2020 high). This being said, the upside move looks to be stretched and it is likely that a pullback/profit taking may follow today’s bullish extension.
The Relative Strength Index (RSI) currently suggests a mean reversion as the previous overbought reading is higher than the current reading (lower highs) although price action appears contradictory (higher highs). This phenomena is referred to as bearish divergence and is indicative of an upcoming turn to the downside.
Resistance levels:
- 15.5735 - March 2021 swing high
- 15.4289
Support levels:
- 15.2000
- 15.0000
Trade Smarter - Sign up for the DailyFX Newsletter
Receive timely and compelling market commentary from the DailyFX team
--- Written by Warren Venketas for DailyFX.com
Contact and follow Warren on Twitter: @WVenketas


