


NASDAQ 100 OUTLOOK:
- Wall Street’s main stock indices suffer heavy losses at the start of the week, with technology shares bearing the brunt of the sell-off
- The Nasdaq 100 slides more than 2% and falls below its 100-day simple moving average, a bearish signal according to technical analysis
- On Tuesday, investors will focus on the ISM No-Manufacturing report for clues on the health of the services sector
Trade Smarter - Sign up for the DailyFX Newsletter
Receive timely and compelling market commentary from the DailyFX team
Most read: Seasonality suggests October may be a good month for the dollar but bad news for risk
U.S. stocks plummeted at the start of the week, dragged by technology shares, as the recent rise in Treasury yields led investors to flee high-flying companies. At the same time, concerns about the debt ceiling, persistently elevated inflation, fresh U.S.-China trade worries and the possibility of higher corporate taxes also weighed on sentiment.
When it was all said and done, the Nasdaq 100 plunged 2.16% to 14472, losing its 100-day moving average, pulled lower by outsize losses in mega-caps such as Amazon, Microsoft, and Apple. Meanwhile, Facebook, the fifth most valuable company, was hit the hardest, dropping almost 5%, after an insider whistleblower accused the social media company of facing no oversight, betraying democracy, and choosing profits over public safety. Elsewhere, the S&P 500 sank 1.3% to 4300, while the Dow Jones fell 0.94% to 34003 points at the closing bell.
With stretched and frothy valuations, the technology sector faces several near-term risks, but one of the main threatsappears to stem from the prospect of tighter monetary policy as the Fed prepares to taper its asset purchase program, a process that could start as soon as next month (November).
The normalization endeavor by the U.S. central bank should bring higher yields across the Treasury curve, weighing on valuations, boosting volatility levels, and ushering a shift in market leadership away from the big tech names. That said, one key sector that may outperform in a rising rate environment is financials, with the XLF ETF likely offering asymmetric upside potential during the last quarter of the year.
Moving on to other near-term catalysts, the September ISM Non-Manufacturing release should be the center of attention on Tuesday. The index is seen growing at a good pace, but decelerating slightly to 60 points from 61.4 in August. Any positive surprises relative to expectations could ease concerns about the slowdown in services spending seen over the summer and lift bond yields, exacerbating negative sentiment towards the technology segment.
Check out the DailyFX economic calendar to make sure you don't miss any market-moving events

NASDAQ 100 TECHNICAL ANALYSIS
After breaking below its 100-day simple moving average on Monday, the Nasdaq 100 has fallen rapidly towards a Fibonacci support in the 14365 area. If sellers manage to breach this floor in the next few trading sessions, the tech index could retreat towards cluster support in the 13950region, where the 200-day SMA converges with the 50% Fib retracement of the March/September rally. On the flip side, if bulls reassert upside pressure and prices manage to pivot higher, the first resistance appears near 14775. Should buyers reclaim this level, there could be scope for a move towards 15150.
NASDAQ 100 TECHNICAL CHART
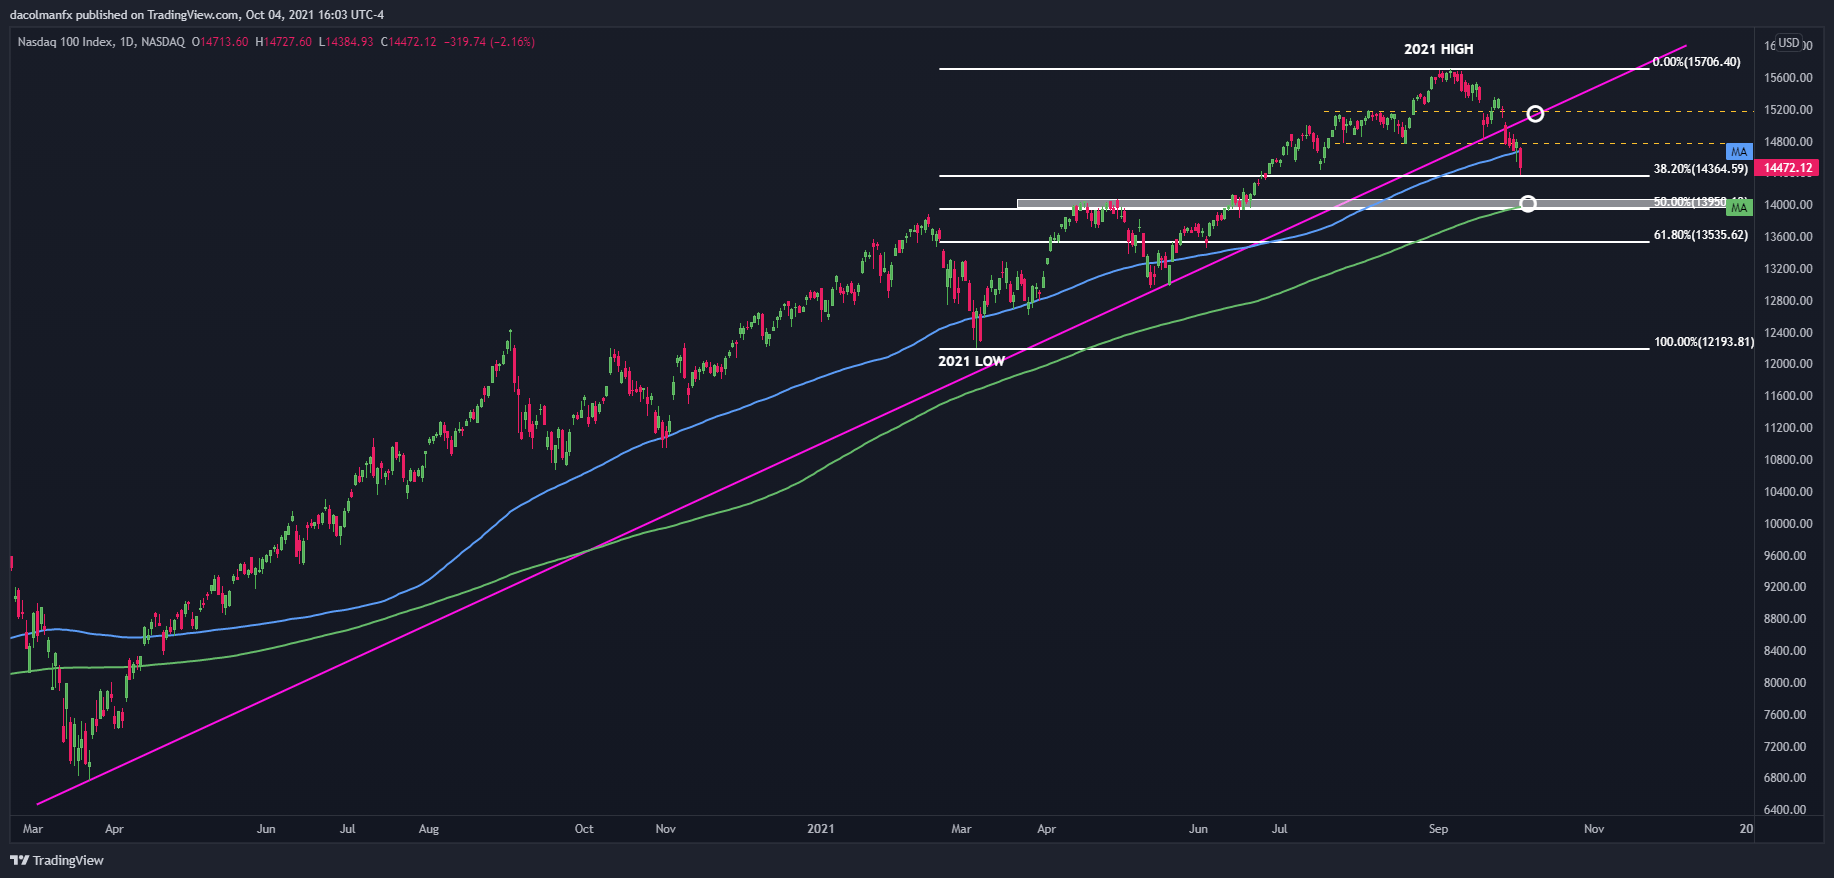
Source: TradingView
EDUCATION TOOLS FOR TRADERS
- Are you just getting started? Download our beginners’ guide for FX traders
- Would you like to know more about your trading personality? Take our quiz and find out
- IG's client positioning data provides valuable information on market sentiment. Get your free guide on how to use this powerful trading indicator here.
- Subscribe to the DailyFX Newsletter for weekly market updates and insightful analysis
--- Written by Diego Colman, DailyFX Market Strategist
about:blank


