


Talking Points
- EUR/USD Consolidates After a 145 Pip Advance
- Current EUR/USD Daily Resistance is Found at 1.1322
- What’s next for the EUR/USD and US Dollar Pairs? Learn more with our Trading Guide
Losing Money Trading? This could be why !
The EUR/USD is consolidating with the formation of an inside bar after advancing as much as 145 pips in yesterday’s trading. When using Tuesdays bar as a reference, the current daily high is acting as resistance at 1.1322. Support may be found using the daily low at 1.1177. With the EUR/USD trading between these values, traders may turn to short term pricing cues to determine if a breakout is impending.
EUR/USD Daily Chart, with Inside Bar
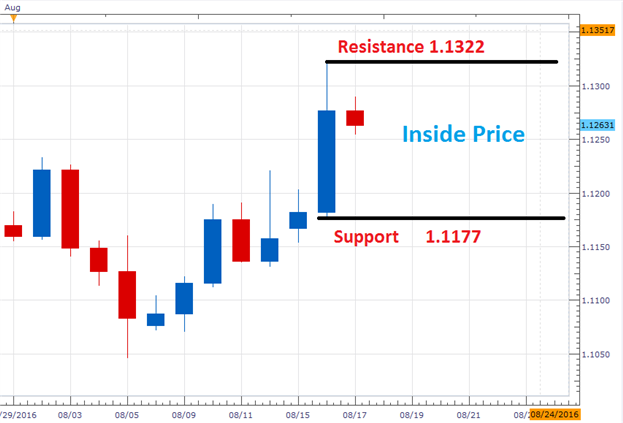
(Created using Marketscope 2.0 Charts)
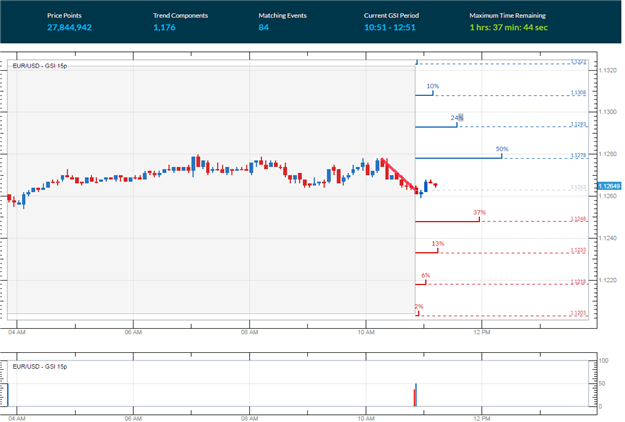
Looking at the 5minute graph below, the EUR/USD can be seen trading off of its most recent swing low of 1.1259. This low has been pinpointed by the Grid Sight Index (GSI) as the most recent low of a short term downtrend, which has developed in the last hour of trading. After reviewing 27,844,942 pricing points, GSI has indicated that price action has continued to decline 15 pips or more in 37% of the 84 matching historical events. This is significant as GSI may suggest further range bound market conditions in the absence of lower lows. It should be noted that the first bearish distribution is found at a price of 1.1248.
GSI has also indicated that prices have advanced by 15 pips or more in 50% of the identified historical matches. The first bullish distribution found in the graph below is at 1.1278. A move through this value would suggest a short term swing in momentum back up towards values of resistance. In If the EUR/USD is poised to break higher, trader should watch for a move to the last bullish distribution at 1.1323. Prices advanced 60 pips in just 1% of historical instances. However, a move to this value would place the EUR/USD 1 pip above yesterdays peak.
Want to learn more about GSI? Get started learning about the Index HERE.
EUR/USD, 5 Minute GSI Chart
To Receive Walkers’ analysis directly via email, please SIGN UP HERE
See Walker’s most recent articles at his Bio Page.
Do you know the biggest mistake traders make? More importantly, do you know how to overcome the biggest mistake? Read page 8 of the Traits of Successful Traders Guide to find out [free registration required].
Contact and Follow Walker on Twitter @WEnglandFX.


