


Talking Points
- The USD/JPY Remains Supported Above Tuesdays Low at 100.67
- Friday’s NFP Announcement May Provide Breakout Opportunities
- If you are looking for Forex trading Ideas, check out our US Dollar Trading Guide
The USD/JPY has found temporary support above yesterday’s low at 100.67. If prices close below yesterday’s high at 102.83, the USD/JPY will close the session creating an inside bar. While using both of these points as a reference, many traders will be looking for a breakout on Friday with the announcement of NFP data for the month of July. Expectations are set at 175k, and any deviation from this expectation may cause US Dollar pairs to react violently.
Are traders long or short the market Find out here !
USD/JPY Inside Bar, Daily Chart
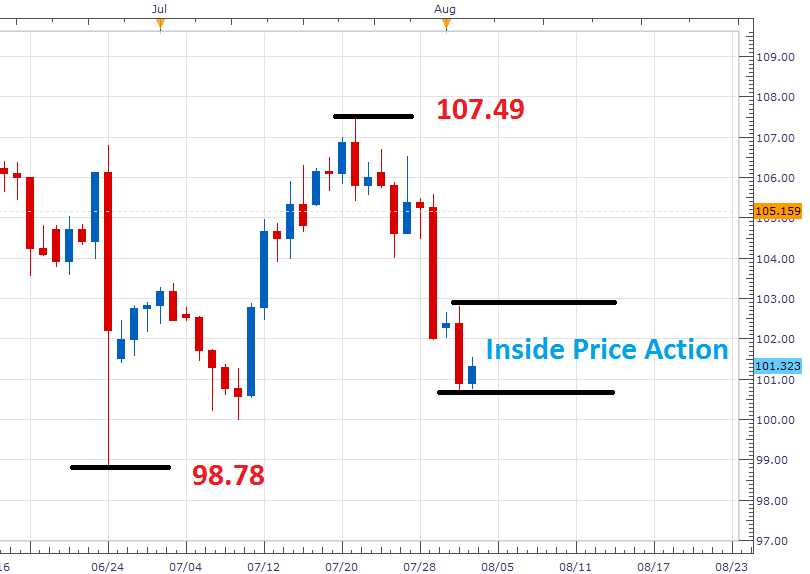
Chart prepared by Walker England
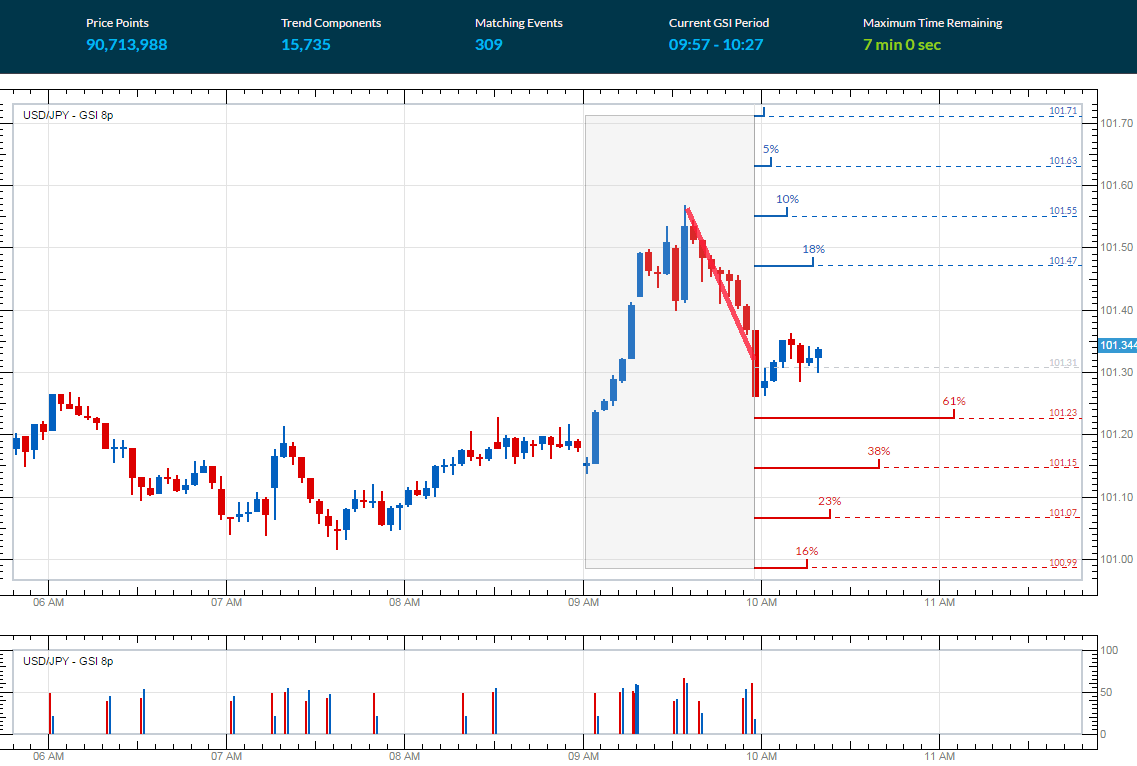
In the 3-minute graph below, we can see the USD/JPY trading lower off of its most recent swing high at 101.57. The Grid Sight Index (GSI) has indicated that short-term momentum has turned lower by highlighting a series of lower lows in the last hour. After reviewing 90,713,988 pricing points, GSI has advanced 16 pips in only 18% of the identified 309 matching historical events. This places today’s first bullish distribution at a price of 101.47. Traders looking for a bullish reversal in the USD/JPY should first look for prices to trade through this point, before testing longer-term values of resistance.
Alternatively, the first bearish distribution is found at 101.23. GSI has indicated that prices have declined eight pips in 61% of the matching 309 historical events. Traders looking for a resumption of the pair’s current downtrend should first watch for price to trade through this value. It should be noted that the final bearish distribution for the day is found at 100.99. GSI has indicated prices have declined 32 pips in just 16% of the historical matches, but a move to this point would open the USD/JPY to testing the previously mentioned point of support at 100.67.
Want to learn more about GSI? Get started learning about the Index HERE.
The ratio of long to short positions for the USD/JPY stands at +3.89. This SSI (speculative sentiment index) reading is extreme, and suggests that the USD/JPY may decline further. In the event that the pair trades to new weekly and monthly lows, traders should look for SSI to remain extreme. Alternatively, in the event of bullish breakout, traders should look for SSI to neutralize back towards negative readings.

To Receive Walkers’ analysis directly via email, please SIGN UP HERE
See Walker’s most recent articles at his Bio Page.
Contact and Follow Walker on Twitter @WEnglandFX.


