


Talking Points:
- MVAs show the average price of a currency for a specific number of periods
- As price moves so will the indicator, giving clues about the current market
- Traders can filter a trading decision based on the position of price relative to a MVA
Simple Moving Averages (MVAs) are considered some of the most widely used indicators in the market and can be a great tool for day trading. Typically MVAs are used for filtering the trend, confirming support and resistance levels, and identifying possible market entries. Today we will look at how MVA’s can specifically be added to any existing day trading strategy as a trend filter. Let’s get started!
The Simple MVA
Before working moving averages into your strategy, its import to know exactly what they are and how they graphically interpret price. Moving averages are technical indicators that are designed to measure the average price presented on a graph for a selected number of periods. While 20, 50 and 100 period MVAs can be used, today’s trading lesson will focus on the 200 period MVA as it is the most prevalent. This means the indicator displayed on your graph has taken the close price for the last 200 periods, added them together and divided that sum out by 200. Once this average is found, it is plotted on the chart and can then be used in your trading.
Below we can see an example of a 1Hour GBPUSD chart, with price trending downward. You should notice as price trends downward, the MVA will begin moving lower as well. At this point price is moving down faster than the 200 period MVA yielding a strong signal that the market is declining and pushing towards lower lows. Knowing this, we can now work the MVA into our trading.
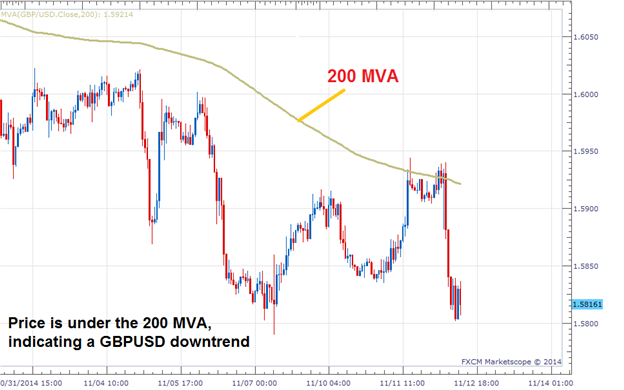
(Image from the DailyFX Trading with MVAs course material)
Trading with a MVA Filter
One of the primary uses of a 200 periods MVA is to determine the direction of the trend. This is an important step for day traders and scalpers to take, because the trend will often influence their trading bias. The idea is that the best trading environment for traders to initiate new buying positions would be in an uptrend as price moves towards higher highs. To identify an uptrend, the price of the selected currency pair on your chart should stay above the 200 MVA.
This bias abruptly changes when prices move below the designated 200 period MVA. Since the price of the GBPUSD, depicted in the chart below, is trading under the 200 period MVA the prevailing trend would be considered down. As price moves towards lower lows and stays below the average, only new sell positions should be considered. Now that you have filtered for the trend, you can focus your attention to timing new entries using your preferred day trading strategy! Let’s look at an example.
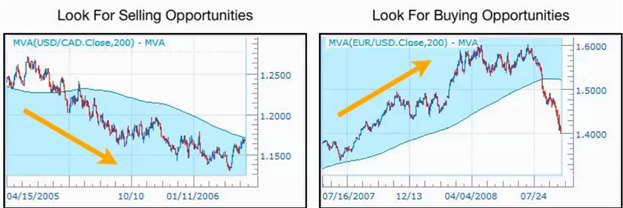
(Image from the DailyFX Trading with MVAs course material)
Pivots and MVAs
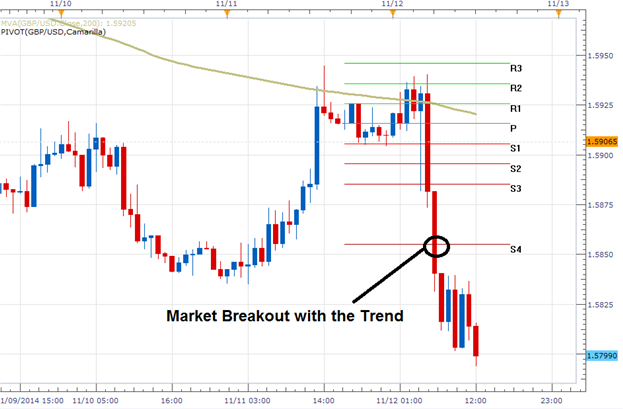
One popular method of day trading Forex pairs is by looking for market reversals using pivot points. Typically in trending markets traders will use these lines of support and resistance to identify areas to enter the market upon price retracements or during a market breakout. The 200 period MVA has simply been added to the chart below to determine if a trend trader will be looking to use one of these strategies to either initiate a new buy or sell order.
Below we can again see the GBPUSD underneath the 200 period moving average. Price is trading below the moving average so at no point should any buy positions be considered. With traders only looking to sell the GBP, one way to initiate a trade using pivot points is to wait for a breakout below the S4 pivot. Once price moved below 1.5855, this breakout allowed traders the chance to enter the market back in the direction of the primary trend.
Suggested Reading: Trading Breakouts with Pivots
Learn More about MVAs
Filtering for the trend is just one of three key ways you can utilize the Moving Average in your day trading! To learn about the remaining two opportunities, sign up for the DailyFX Moving Average Trading Course. Registration is free, and the course includes video as well as checkpoint questions to test your knowledge. Get started using the link below!
Register me for the “Trading with Moving Averages, Strategy Course”
(Valid name, email, phone number, and country are needed)
---Written by Walker England, Trading Instructor
To contact Walker, email instructor@dailyfx.com. Follow me on Twitter at @WEnglandFX.
To be added to Walker’s e-mail distribution list, CLICK HERE and enter in your email information


