


Talking Points:
- Yearly Pivot Points are one type of Forex support and resistance used by traders.
- Bounces from yearly pivots usually lead to several hundred pip moves.
- USDCAD has broken above the R1 Pivot and is now less than 96 pips from the R1 pivot
This is the fifth in a series of articles dedicated to yearly pivots points. Yearly pivot points is a remarkable method for creating a long term trading outlook based solely on price action and its behavior at or near a significant level of support or resistance. We have already looked at the Euro, USDJPY, GBPUSD, and AUDUSD.
USDCAD the next currency pair that we will look at how effective trading using 2013 yearly pivots. Then we can plot 2014 Forex yearly pivot points on USDCAD. Since these are yearly pivot points, they are only drawn once. They predict potential areas of support and resistance that traders can use to enter and exit trades. They are rigid and do not float, move or repaint because these levels are created using the pivot point formula and the High, Low, and Close of the year.
Pivot Point = (Previous High + Previous Low + Previous Close) / 3
The other levels are created using the aforementioned Pivot value. Marketscope contains the pivot point indicator for daily, weekly and monthly levels, but yearly has yet to be added. The lines on my chart are drawn manually for your use.
Resistance Level 1 = (2 * Pivot Point) - Previous Low Support Level 1 = (2 * Pivot Point) - Previous High Resistance Level 2 = (Pivot Point - Support Level 1) + Resistance Level 1 Support Level 2 = Pivot Point - (Resistance Level 1 - Support Level 1) Resistance Level 3 = (Pivot Point - Support Level 2) + Resistance Level 2 Support Level 3 = Pivot Point - (Resistance Level 2 - Support Level 2) |
Learn Forex: USDCAD 2013 Yearly Pivots
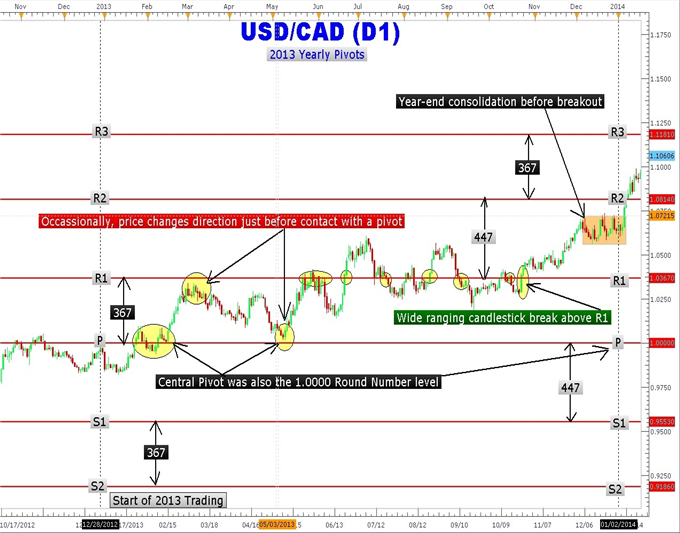
Created with Marketscope 2.0
As you can see in the above USDCAD daily chart, price rallied in late December and into January stopping at the central pivot (P) and reversing. From January 23rd to February 18th, USDCAD consolidated in a chopping range popping up above the central pivot and back down below the central pivot. A breakout of that range takes USDCAD just short of the R1 pivot. Then the pair returns back within a few pips of the central pivot on May 9th.
One important concept to understand is that these support and resistance areas are not concrete barriers but more like zones of support and resistance. Price may come within 50 pips of a yearly pivot on either side and then turn around. This would be considered a valid touch.There were a number of touches and breaks of the R1 pivot for 5 months before the October 25th 360-pip breakout to the 1.0725 area. To finish out 2013.
Learn Forex: USDCAD 2014 Yearly Pivots
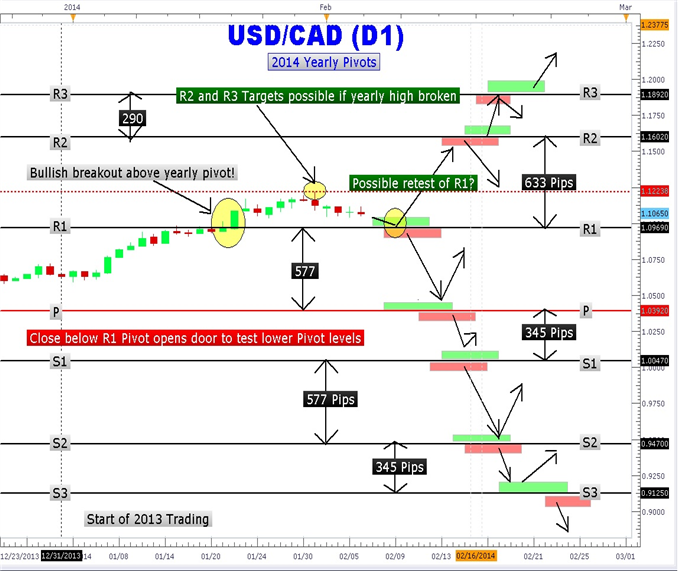
Created using Marketscope 2.0
The 2014 USDCAD Yearly Pivot Trading Plan
With USDCAD so close to the yearly forex pivot at 1.0969 area, the current correction may find support at the R1 pivot (1.0969) or turnaround from current levels. The first target would be the old yearly high of 1.1223. A close above this high could open a path to the R2 pivot at 1.1602 and the R3 pivot at 1.1892.
Friday’s 8:30AM ET US Employment number could be the spark that ignites a massive rally to the upper pivots. On the other hand, USDCAD could sell off if the employment number comes in lower than expected. Over the course of a few weeks, price may move below the R1 pivot and move down to the central pivot down at 1.0392.
As with any type of support and resistance, Forex traders are looking for breaks or bounces from these key areas. These areas are watched heavily by Forex traders around the world and often are used as option levels as well. So you may want to print this article out and pin it on your wall or just simply place a couple of the nearest yearly pivots on your charts for reference.
---Written by Gregory McLeod Trading Instructor
This article showed you how to identify potential areas of strong support and resistance in the form of yearly pivots.
To extend your knowledge take this free interactive video tutorial on the Trade like a Professional. If you have 2 hours to invest in learning to trade well, then sign my Guestbook that will also give you a Universal Access Pass to other fine Forex lessons.
Watch Greg McLeod at 9:30 ET in the DailyFX+ Live Classroom


