


Aussie Finds Support as Risk Trends in Question
As traders, we often have short memory spans as the pains of yesterday lead into the opportunities of tomorrow.
Getting discouraged over a single trade can, often-times, affect our psychology enough to denigrate our analysis on future trades. This is a disservice few of us can afford, as we want the upmost in cogency when speculating in markets.
This theme can become a concern when regarding support and resistance, as short-memories can cause traders to forget levels of special importance as new highs or lows leave the support or resistance of yesterday behind. We’ve got a rather compelling example in AUD/USD, with its recent intersection of the 1.0650 support level.
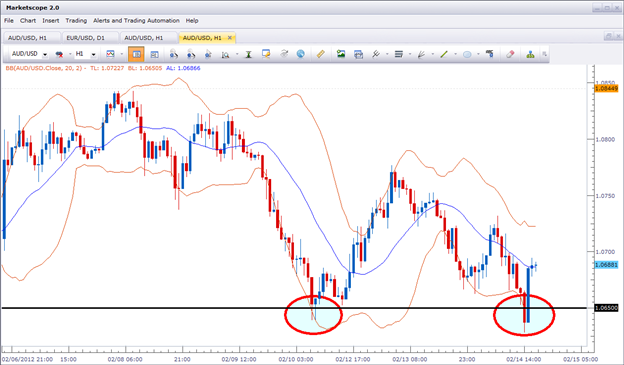
Created with Marketscope/Trading Station 2
At first glance, this level may seem of no special importance outside of the previous bounce you can see on this hourly chart. But if we scroll back in time, we can see that this same level was of importance during another period on AUD/USD.
The chart below is the 4 hour chart from the 2nd quarter of 2011; a period in which the market was very much struggling with the prospect of continued growth in the economy versus the potential devastation of a re-emergence of the 2009 financial struggles.

Created with Marketscope/Trading Station 2
As you can see above, we can probably classify this period as a ‘violent range,’ given that it appears to be rather unpredictable. Circled in red are some of the more prominent tests of this level.
Many of these movements are sparked by news announcements that traders are speculating on with short-term goals; lacking the conviction to bid price above longer-term resistance or below longer-term support.
In the 2nd chart, 1.0650 functions as the ‘mid-line,’ of the range. This offers traders a point of emphasis for their range analysis. Looking for support tests below the ‘mid-line,’ or resistance runs above the ‘mid-lines,’ with the goal of trading price back to the mean.
But this took place in April through July of 2011, how can this help me today?
Well, first thing is first, we can feel rather confident that at least SOME traders are utilizing this price for Support and/or resistance. The multiple inflections that had taken place in the past show that this level has had a proclivity to support and/or resist price. So we know this level might be important, but how do we know this level may be pertinent in the current market environment?
Well, we don’t. And we never will. All we’ve got to go on here are probabilities, and probably the most important tool in the trader’s arsenal – risk management.
In the research article The Number One Mistake Forex Traders Make, David Rodriguez outlines the number one cause of failure for retail Forex traders as improper risk-reward ratios. In the article, David states the thesis as:
“Traders are right more than 50% of the time, but lose more money on losing trades than they win on winning trades. Traders should use stops and limits to enforce a risk/reward ratio of 1:1 or higher.”
The conclusion that David came to is a large part of the reason I love these types of trades.
By hypothesizing that support was recently confirmed; and by further hypothesizing that we may, in fact, be looking at a range with the possibility of a resistance test in the not-too-distant future – I can potentially see an aggressive, and favorable risk reward ratio on the trade.
The chart below illustrates the potential setup:

Created with Marketscope/Trading Station 2
By placing my stop slightly underneath the extreme swing low (appr
oximately 1.0625), and looking for profits in the neighborhood of previous resistance (1.0820), I could potentially profit 2 times my initial risk as of current market price at the time of writing.
--- Written by James B. Stanley
To contact James Stanley, please email Instructor@DailyFX.Com. You can follow James on Twitter @JStanleyFX.
To be added to James’ distribution list, please send an email with the subject line “Notification,” to Instructor@DailyFX.com.
Additional Resources:
Support and Resistance – On-Demand Video Course
Money Management module -- On-Demand Trading Course
“What is the Number One Mistake Forex Traders Make?”
Trade the News – On Demand Video Course
http://forexforums.dailyfx.com/dailyfx-education-videos-forex-trading-strategies/126485-dailyfx-money-management.html


