


Talking Points
- Crude Oil Declines Ahead of Canadian CPI Data
- Critical Daily Resistance Found at $48.72
- Sentiment Flips Negative Pointing Toward Price Advances ; 55% of Positioning is Short
Access Our Free Q3 Oil Outlook HERE
The price of WTI Crude Oil (CFD:USOil) has continued to trade higher, after breaking out from critical resistance earlier in the week. Now going into this weeks close, Crude Oil Prices are trading off of their highs ($48.72) and may close lower on the day. With its tight correlation to the USD/CAD, Oil traders should also be watching this morning’s CAD CPI release. Expectations are set at 1.4% (MoM) (Jul), and any deviations from these values may cause an increase in volatility in Crude Oil Prices. If prices rise, traders should look for Crude Oil to press on weekly highs above $48.72. Alternatively if prices decline, Crude Oil may trade back below today’s swing low at $47.91.
WTI Crude Oil Price (UsOil), Daily Chart
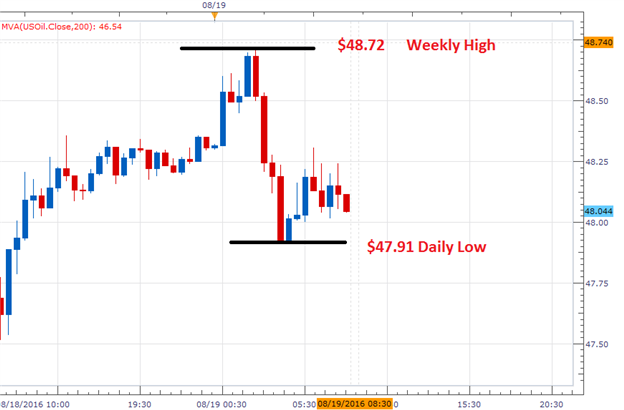
Chart prepared by Walker England
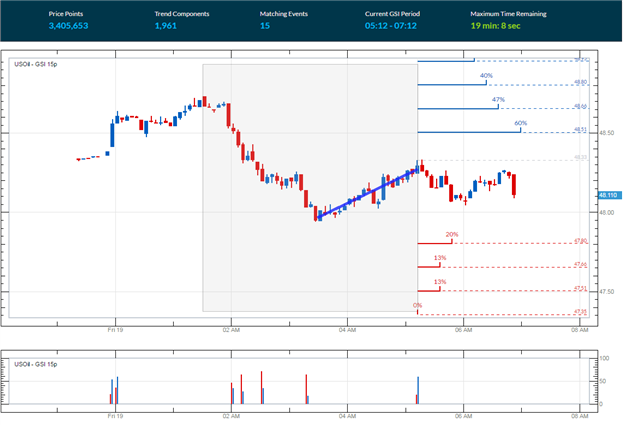
Short term price action for the price of Crude Oil may be seen in the 5 minute graph below. Currently, price action can be seen advancing off of their current daily lows The Grid Sight Index (GSI) is also highlighting a short term uptrend, with a series of higher highs put in place over the last 2 hours of trading. After reviewing 3,405,653 pricing points, GSI has indicated that price action has continued to advance $0.18 or more in 60% of the 15 matching historical events. This places today’s first bullish distribution at a price of $48.51.
Alternatively, GSI has indicated that prices have declined by $0.53 or more in 20% of the identified historical matches. Today’s first bearish distribution is found at $47.80. If prices trade through this point, it would suggest that a broader retracement is developing for Crude Oil prices. In this scenario traders may look for prices to test historical values of support, including $47.51.
WTI Crude Oil (UsOil) 5Minute GSI Chart
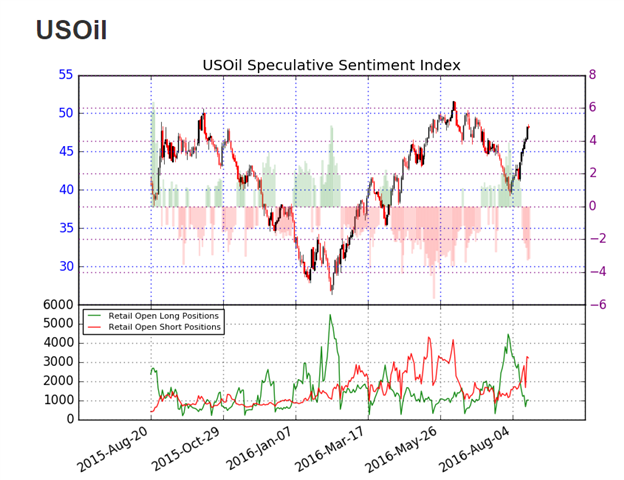
Sentiment for WTI Crude Oil (Ticker: USOil) has grown to a negative extreme, with SSI (speculative sentiment index) reading at -3.17. With 76% of positioning now net short, this may indicate further gains for Crude Oil prices. In the event that Crude Oil prices continue to breakout higher, traders may look for SSI to remain at negative extremes. Alternatively if Crude Oil prices continue to retrace lower, SSI would be expected to retract towards more neutral readings.
Are traders long or short the market? Find out here !
To Receive Walkers’ analysis directly via email, please SIGN UP HERE
See Walker’s most recent articles at his Bio Page.
Contact and Follow Walker on Twitter @WEnglandFX.


