


Searching For Concise Recommendations That Can Improve Your Trading Skills? Then Our Traits Of Successful Traders Guide Is An Excellent Material For You! Obtain Them HERE
Talking Points:
- So far, August being a great month for SEK against EUR
- Bounce from consolidating Triangle pattern
- Will the weekly upward channel dictate the direction for EUR/SEK?
August has been a pretty good month for the Swedish Krona against the Euro as out of the 10 trading days, 7 have registered a drop for the cross and more than half of these negative days have registered a drop above the average negative drop since April of 2014.
Short-Term Technical Outlook:
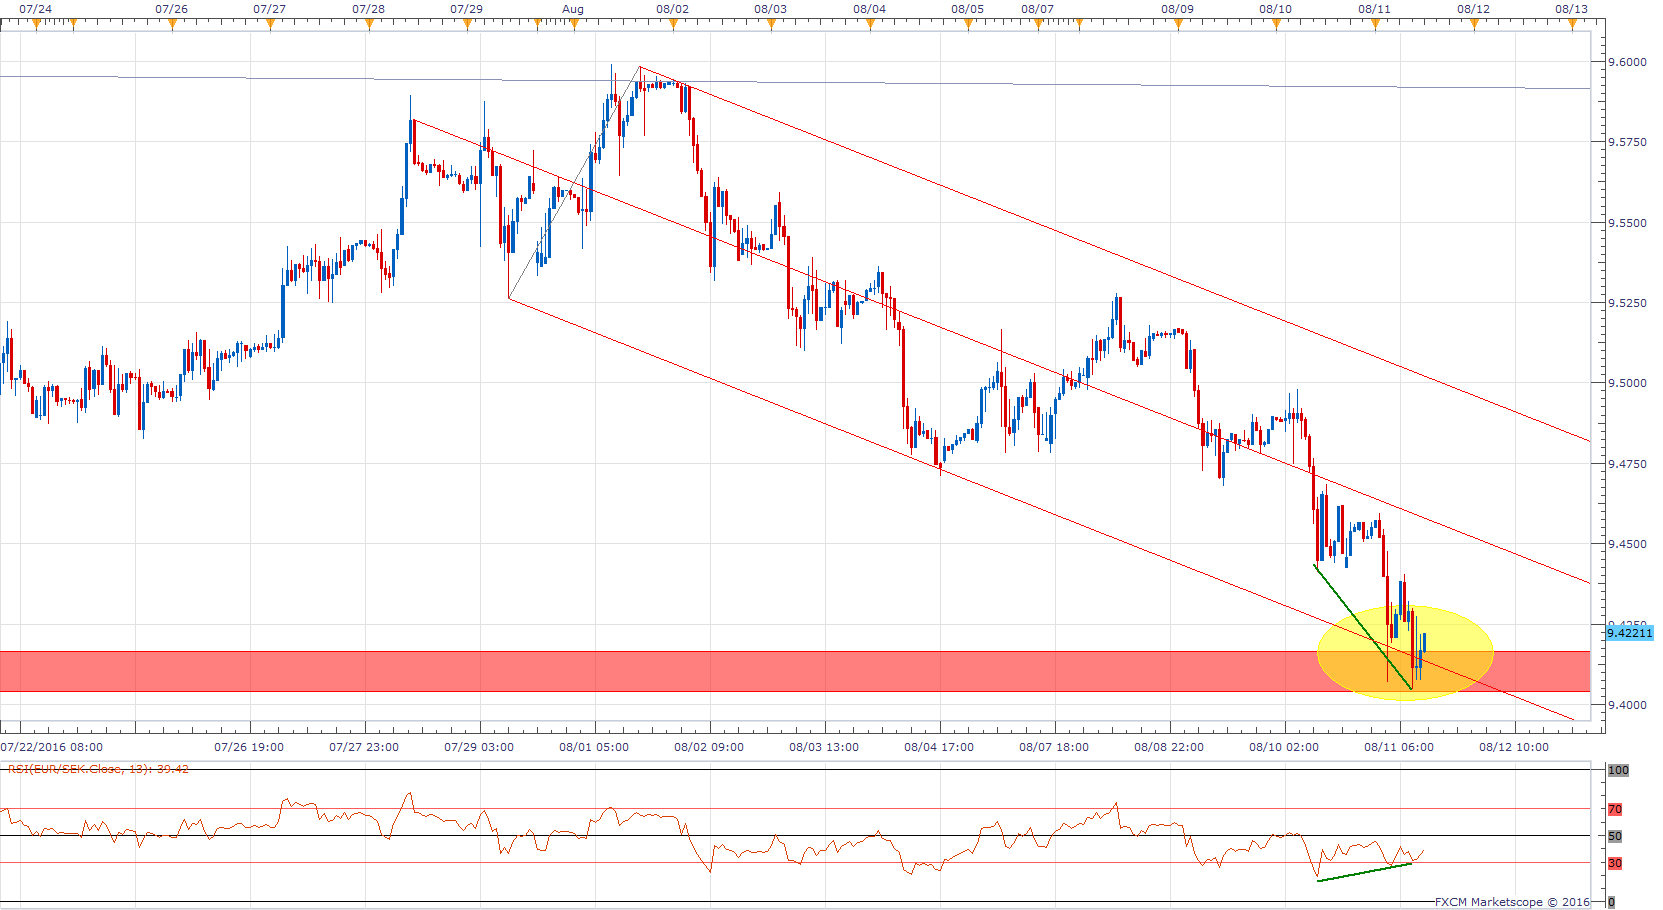
As presented in the chart below, since the high of July, trading action has taken place within the confined channels of a downward Andrew’s Pitchfork. Pitchfork at which current prices are hovering right at the bottom line of this channel, signaling that there is a high potential for a retracement for EUR/SEK in the short-term future as trading action seems to be respecting the channel.
Supporting this perspective, we also have a negative divergence between our 13 Period RSI and price action, behavior that is commonly seen when price action is exhausting its momentum on the direction on which it has been trading.
EUR/SEK 1-Hour Chart
(Created Using Marketscope 2.0)
Bigger Picture:
EUR/SEK Daily Chart

(Created Using Marketscope 2.0)
Depicted in the chart above we can observe that since October of 2014, EUR/SEK has been trading in a consolidating triangle, time at which the pattern registered its lowest level. On the other side, on December of 2014, the highest level for this pattern was registered. After that, the cross has been bouncing between the confined levels of this pattern several times with the last one being at the beginning of this month.
After reaching its upper line at the beginning of this month, EUR/SEK bounced back inside the pattern an accelerated its downside momentum (as mentioned in the opening paragraph), a movement that, therefore, brings to the table the picture that the cross might be heading to the lower line of this consolidating triangle.
Currently, EUR/SEK is hovering above its 55 EMA. For further confirmation of this downward trend, a breakout of the aforementioned technical level would be needed. In addition, today’s low was registered at the 38.2% Fibonacci retracement from the April low and the October high of this year. Therefore, this confluence zone of technical levels could represent a key resistance zone for the cross in its downside momentum.
EUR/SEK Weekly Chart

(Created Using Marketscope 2.0)
Going further back in time, we could observe that the above consolidation pattern is taking place within a longer term upside channel, a channel that started taking place 4 years ago in August of 2012.
Bottom Line:
Given that on a short-term EUR/SEK is running out of steam and in a longer period of time the cross is hovering above important technical levels, there is a high potential that the cross will take a break on its downward momentum. Therefore, we could see the cross trading around the 38.2% Fibonacci retracement level before trading lower towards the support line of this consolidating triangle pattern.
As a contrary perspective, instead of trading back to levels of its low line of the consolidating triangle, the cross respects the lower line of the weekly upward channel and bounces from in order to start looking for higher levels bringing to an end the consolidating triangle above.
If you are interested in knowing more where the EURO might be heading, CLICK HERE !
Are you a short-term trader? Then GSI is a must have tool for your trading! Check it out HERE
Written by Quasar Elizundia


