


Talking Points:
- Always wait for the current candle to close beyond the trendline to confirm the break.
- Enter into the trade when price retraces back within a few pips of the original trendline, trading in the direction of the original breakout.
- Set your Stop a few pips beyond the trendline and set your Limit at least twice as far as your Stop.
In the last couple articles I’ve written, we have focused on drawing trendlines and understanding how to enter trades and exit trades based upon those trendlines. The response was great and I received a lot of emails from our readers with feedback and additional questions. The most popular question I received was “how do I trade a trendline if it breaks?” I decided it would be best to respond in article format.
We all know that no trendline will last forever. So this article focuses on how to trade trendlines when they break.
Step 1. - Locating the Trendline
As a review, a trendline is a line connecting two or more lows or two or more highs, with the lines projected out into the future. Traders than look at these projected lines and look for future prices to react around those levels. For a detailed lesson in identifying and drawing valid trendlines, check out my 3 Tips For Trendline Trading.
On the chart below is an example of a trendline that developed today on the GBP/USD on an Hourly chart. You can see how I connected the two swing lows to create a line and projected that line out into the future.
Learn Forex: Locating a FX Trendline
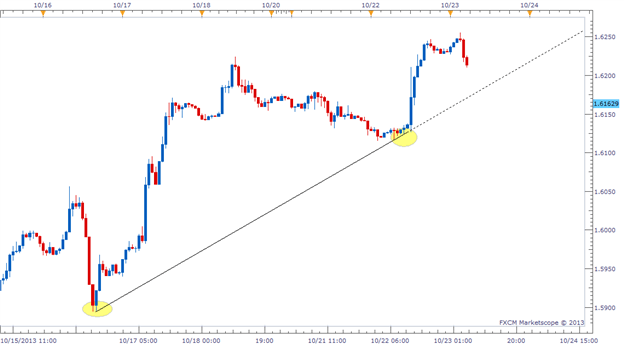
Created by Rob Pasche
Step 2. – Wait For a Confirmed Breakout

Next, we need to see how the price reacts to the projected trendline. There are two potential outcomes when price comes into contact with a trendline:
- The price will bounce off the trendline
- The price will break through the trendline
This article focuses on the latter. So we wait to see if the price does in fact break through the price. But we aren’t ready to place a trade just because the price breaks through the trendline. We need to wait and see if the current candle closes beyond the trendline. We require a candle to close beyond the trendline to confirm the breakout. This is a very important rule.
Learn Forex: Watch for False Breakouts
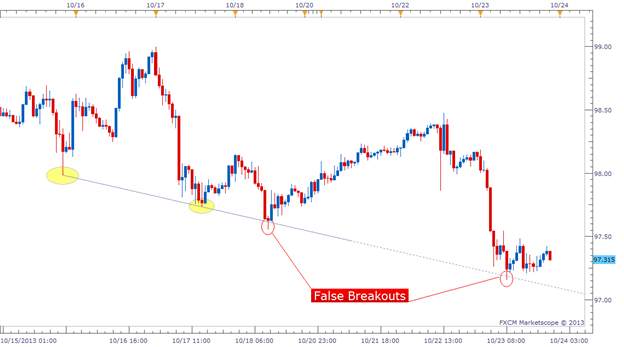
Check out the chart above depicting a trendline on a current USD/JPY Hourly chart. There were two times in the past week where this trendline was broken, but look what happened. They were false breakouts. Sellers were not able to keep the price down below the trendline and both potential breakout candles closed above the trendline. Had we sold at either of those two opportunities, we would have been crushed two times in a row. Something we definitely want to avoid.
So even though it is tempting to get immediately into a trade as price breaks a trendline in real-time, you would be susceptible to false breaks. Patience is a virtue.
(One argument that some traders will make against this piece of advice is that if you wait for the candle to close, you run the risk of getting into the trade too late and end up entering at a less favorable price. This argument is completely valid, but I haven’t explained our simple way to get into a confirmed breakout trade and still receive a favorable price. Consider the following example.)
Step 3. Set Up The Trade
Remember the first image I showed you of the GBP/USD Hourly chart? Let’s go back to that example because it actually ended up producing a near perfect breakout setup. Soon after that snapshot was taken, the GBP/USD fell and broke through our trendline with authority. A very short time after that, the Hourly candle closed below the trendline and confirmed the breakout as well. Once this happened, it was time to get to work to setup this trade.
There are 3 things we needed to do to execute this breakout trade:
- Set an Entry order to Sell just below the original trendline.
- Attach a Stop order several pips above the trendline.
- Attach a Limit that is as least twice as large as our Stop .
There is a saying that goes “What once was resistance, can later become support. And what once was support, can later become resistance.” This is the mantra we rely on when setting an Entry order near the original trendline. We are looking for price to retrace back to the point of support/resistance it just broke through, and then continue back into the direction of the original breakout. Take a look at how the trade was setup below. I magnified the main part of the chart so it’s easier to read.
Learn Forex: Setting Up Trendline Breakout Trade
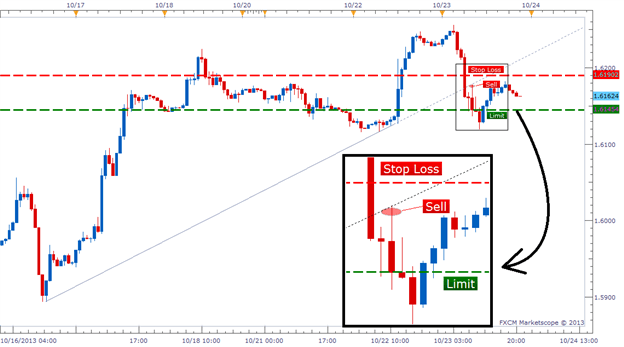
Our Entry order to Sell was placed a couple pips below the trendline, our Stop Loss was set several pips above the trendline (approx.. 15 pips from our Entry) and our Limit was set twice as far as our stop (approx. 30 pips from our Entry). Within the next hour, the price retraced back to the original trendline, and then move back in the direction of original breakout, exactly what we wanted.
So to recap, we were able to enter into a trade on a confirmed breakout, we were able to get in at a much more favorable price than entering the break in real-time, and we were able to set an extremely tight stop (read: lower our risk) beyond what should be a valid resistance level.
As it turned out, this particular trade was a success, but that doesn’t mean every trade will be a winner. However, you should take comfort in the fact that as long as you are using a 1:2 risk/reward ratio, you only need to be correct 33% of the time to break even. If you are right more than 33% of the time, you should be a profitable trader in the long run with this strategy.
Breaking Bad
Trendline breaks can be tricky to trade, but hopefully this article gave you a clear approach to mastering them. We've learned that you should always wait for confirmation of a break by requiring the current candle to close. We also learned placing our Entry order near the trendline will give us a better entry price and reduce our risk by allowing a tighter Stop. Setting our Limit as least twice as far as our Stop should also help shift the odds in our favor. Good luck with your trading!
Good trading!
---Written by Rob Pasche
Interested In Our Analyst's Best Views On Major Markets? Check Out Our Free Trading Guides Here


