


Talking Points
- Renko harts filter out the noise of wicks and are based solely on price without time.
- Renko charts clearly indicate support and resistance.
- Can be used to confirm trends or can be traded on their own.
Have you ever been stopped out of trade only to have it move in the direction you originally thought?
Do you have trouble recognizing trend direction?
If you answered “Yes” to either one of these questions, then you may want to give Renko charts a try.
Learn Forex: GBPUSD Renko Chart Bank of England
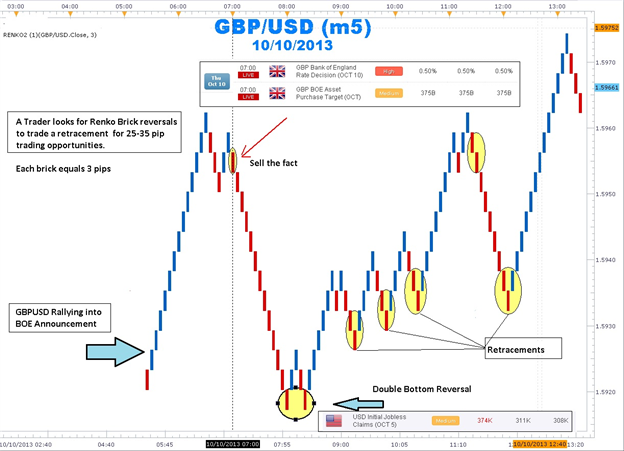
Renko means brick in Japanese. Every brick is the same size and a new brick is drawn one brick size below or above the brick before it. Bricks that are adjacent never overlap. Every brick starts where the previous brick ends. Traders can specify the size of bricks in pips. In the example above, the distance from the high and low of the brick is three pips. So a ten brick move is equal to 30 pips (10 bricks times 3-pip height brick).
Price can move above and below the previous brick until the minimum number of bricks is met. This may be a surprise for most traders who are used to a new candle being formed at a specific time. We can see 13 bricks in a row heading up going into the Bank of England rate decision. Once the decision is released the bricks changed in color from blue to red and there was a lower high leading to a 13 brick decline.
A double bottom that happened when the US Initial Jobless Claims was released ended the selling and the uptrend resumed on the weaker US data. The negative sentiment for GBPUSD following the Bank of England interest rate announcement could be easily seen with streak of red bricks.
How to Trade Using Renko
A simple system could be used in which if we have 2 bricks of the same color establishes a trend that we could use as a trigger to either get long or short. On the other hand, a 1 brick of the opposite color ends the trend and we would exit the trade.
Learn Forex: EURAUD Renko Chart Long and Short Trade
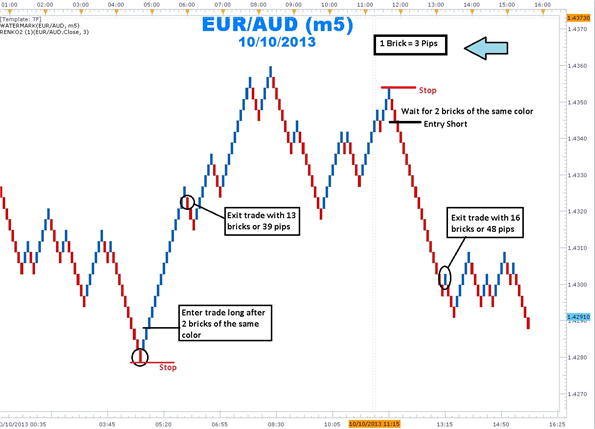
By filtering out time and whipsaws, Renko charts were able to map out market sentiment within small time frames like the 5-minute chart which usually have a lot of noise. However, Renko has its drawbacks. When a line of bricks goes into a range changing color after 2 or 3 bricks, traders can get whipsawed by price action.
It is easier to stand aside and wait for Renko bricks to move from the congestion channel and begin trending again. This can be clearly seen at the end of the EUR/AUD chart as the line of bricks breaks out to a new low clearing past the previous congestion area.
In sum, it is easy to see that Renko charts can provide forex traders with a new and fresh way to approach price action. Being based on price action rather than time, traders can stay with trends longer and exit with confidence with clear signals.
I encourage you to try trading with forex Renko charts in your demo account. Email me and tell me how they are working for you.
--- Written by Gregory McLeod, Trading Instructor
To contact Gregory McLeod, email gmcleod@dailyfx.com.
Interested In Our Analyst's Best Views On Major Markets? Check Out Our Free Trading Guides Here


