


Article Summary: Market turns after an extend trend can be difficult to identify. Learn to spot market direction using the Aroon indicator.
Knowing when a trend has run its course can be a difficult task for Forex traders. However, this information can be vital as traders need to decide how to manage existing positions or even open new trades with the trend. A great example of this is displayed below on the EURJPY daily chart. We can see price advancing 2739 pips, but then sharply declining. Which begs the question, has the trend turned? To find out, today we will review the Aroon indicator.
Learn Forex – EURJPY Daily Trend
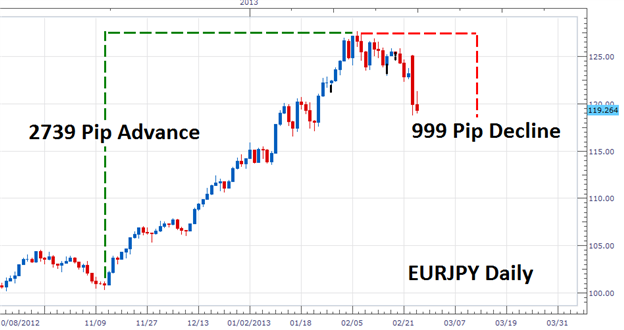
(Created using FXCM’s Marketscope 2.0 charts)
The Aroon Indicator
The Aroon indicator was specifically designed to help traders find the trend and spot potential reversals. The indicator itself is derived from two lines, Aroon Up and Aroon Down. Both lines run in a defined range between 0-100, to help derive a currency pair’s strength or weakness. As seen below, Aroon Down is depicted as a green line and as its name suggests helps track price in a downtrend. Aroon Up is depicted as a red line and measures the strength of an uptrend. Traders will watch both lines as they oscillate between 0-100 and change their market preference as one line crosses above the other. If Aroon Down is above Aroon Up the trend is considered down with price expected to go lower. The opposite holds true if Aroon Up is residing above Aroon down. So how does this apply to our EURJPY example?
Below we can again see our EURJPY daily trend, but this time we have added the Aroon indicator. Even though the pair has declined over the past two weeks, the Aroon Up line still resides above the Aroon Down line. Knowing this, trend traders can look for a price bounce as the trend is expected to continue. Even though Aroon Up is currently prominent, this can be subject to change. This analysis would be completely invalidated if price continues to fall, driving the Aroon Down line over Aroon Up.
Learn Forex – EURJPY with Aroon

(Created using FXCM’s Marketscope 2.0 charts)
Based off of our Aroon analysis, my preference is to look for the EURJPY up trend to continue. One way to trade this retracement is to enter on a market swing or even a breakout to higher highs. Regardless of the strategy taken, traders should keep an eye on the Aroon indicator. If the Aroon Down crosses over the Aroon Up this may signal an end to current the EURJPYS up trend and a change to market direction.
---Written by Walker England, Trading Instructor
To contact Walker, email instructor@dailyfx.com. Follow me on Twitter at @WEnglandFX.
To be added to Walker’s e-mail distribution list, CLICK HERE and enter in your email information
Are you looking for other ways to interpret support and resistance levels? Take our free course on trading Fibonacci Retracements !


