


Student’s Question:If you get the time would please post an example of a histogram divergence, I think I know what it is but an example would make it more clear for me and maybe the other students would like to see it too, thanks, CB.Instructor’s Response:Sure...You will find several examples of histogram divergence on the chart below...
In a nutshell, here is the way that histogram divergence would be used by a trader.
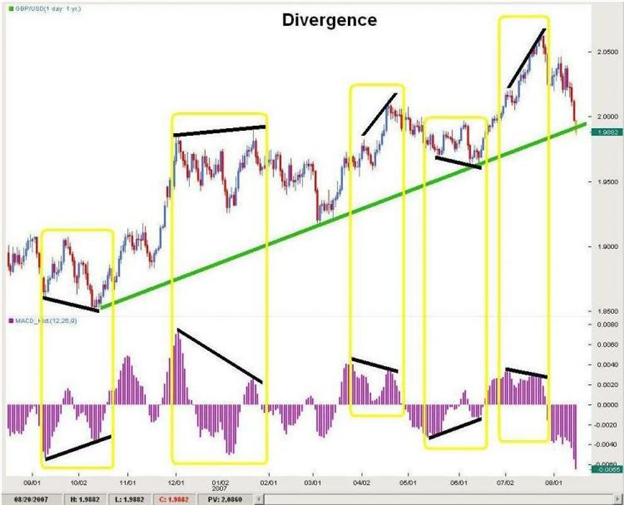
When price prints a new low but the histogram bars do not, it shows that momentum on the pair based on the indicator is bullish. As such, the trader can look to the price chart for a technical reason to buy the pair. (This condition is shown in the first yellow rectangle below.) Conversely, when price prints a new high but the histogram bars do not, it shows that momentum on the pair is bearish and the trader can look for a technical reason to sell the pair. (This condition is shown in the second yellow rectangle below.)


