


Talking Points:
- Fundamental events and data prints often shape future price movements in the FX market
- Technical analysis can do a great job of explaining what has happened in the past
- Traders can integrate the two systems of analysis with risk management to find the cleanest setups
In our last article, The Nucleus of the Forex Market, we looked at one of the major fundamental drivers in the market today: Trade flows. In this article, we’re going to take things a step further with something more tangible; something you can use to supplement your trading approach today.
A common question posed to newer traders is as follows: ‘Are you a Technical trader, or a Fundamentals trader?’ This implies that a speculator should, at some point, choose one or the other and develop that skill-set, while eschewing the other form of analysis in the interest of saving time and resources.
Analysis is analysis…. That’s it. Analysis is simply a way to find trade setups, or to get ideas for potential trade setups… Your analysis does not define your role as a trader.
And further – why in the world would you want to ignore an entire permutation of analysis that could impact your trades, your positions, and your strategies?
Even if you have a bias that technical, or fundamental analysis may work better – it is often the best advice to look to incorporate BOTH schools of analysis into your trading approach. In this article, we’ll teach you a way to do just that.
Defining Chaos
What creates price movements?
The simplest explanation is that buyers and sellers move prices. If there are more buyers, prices move up; more sellers and prices move down. But what creates these additional buyers or sellers in the first place?
There could be a few different answers to this question, but one of the most common motivations for price movements comes from data prints and announcements, i.e. fundamental events.
As data comes into the market traders, portfolio managers, and investment banks rush to incorporate this new information into prices.
One of the main ‘motivators’ of price movements comes from fundamental data announcements
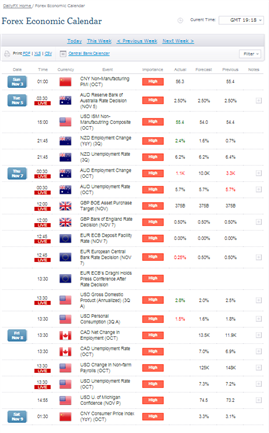
The DailyFX Economic Calendar showing High Importance Events
For example, usually on the first Friday of every month the US Department of Labor releases the Non-Farm Payrolls report (sometimes on the second Friday of the month such as the upcoming release on November 8th, 2013). This is the number of new jobs added in the largest single economy in the world, and this is often the first look investors get at the most recently completed month.
This number is purposefully released a full-hour before US equity markets open because the volatility that can come from the event can be enormous. And while stock traders have to wait on the sidelines for a full hour to trade on this data, often seeing markets gap massively higher or lower to incorporate the newly-released information; currency traders can see this getting priced into pairs instantaneously.
As an example, let’s take a look at the NFP release from September the 6th below:
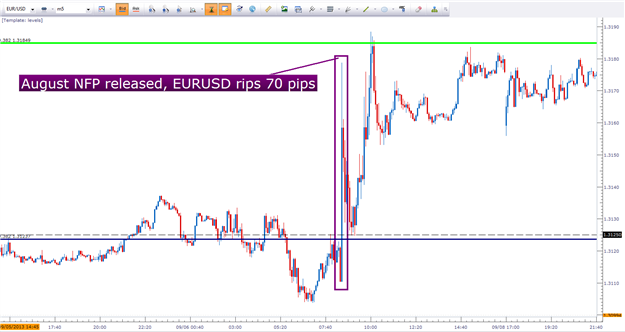
Created with Marketscope/Trading Station II
But maybe even more important than the short-term volatility – look at what happened to the intermediate-term trend!
Data prints can create strong reversals and/or price movements in markets
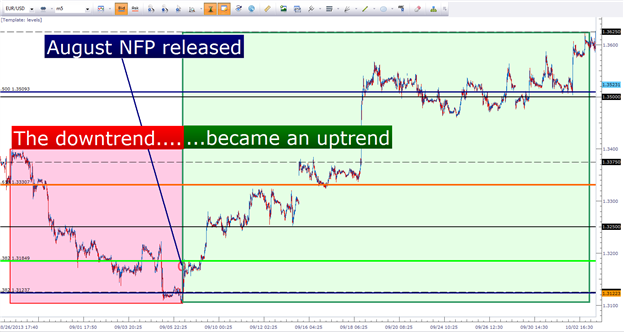
Created with Marketscope/Trading Station II
As you can see in the chart above, NFP on September the 6th provided a complete change of direction the EURUSD. Over the next two months, the EURUSD moved up over 600 pips, and NFP was the catalyst for the move.
So, if fundamental data prints can evoke so much interest, volatility, and pervasive price movements – why not trade on fundamentals alone?
Well, that NFP release on September the 6th was unpredictable. Nobody knew how that would come out; and further – even if we did know what the NFP number was going to be – there is no way to predict what prices would do in response.
So, if fundamental analysis helps shape price movements – but these data prints are unpredictable, how can we use these in our trading approach?
Well this goes right back to why you don’t want to focus on just fundamentals, or just technical analysis; and instead take an honest, unbiased look at the market using as much information as you can get.
Price Action can show you what HAS been important
In the realm of technical analysis, there are a lot of different ways of deciding what to trade or how to analyze markets. Price Action is often a favorite because, in many ways, this is the most pure form of Technical Analysis.
While technical indicators can give you an idea for what prices have done in the past, price action focuses solely on the price movements themselves; stripping away any inefficiencies that may come from using extraneous indications. We introduced the concept of price action in the article, Four Simple Ways to Become a Better Price Action Trader.
With price action, traders can grade trends and identify support and resistance – and this can be pivotal; particularly when looking at situations such as that reversal in EURUSD that we investigated a moment ago.
Price Action can show help traders find risk-efficient entries
Created with Marketscope/Trading Station II
Below we can see what ended up happening with that EURUSD trend…
Traders can be patient when looking for a reversal to try to get the probabilities on their side
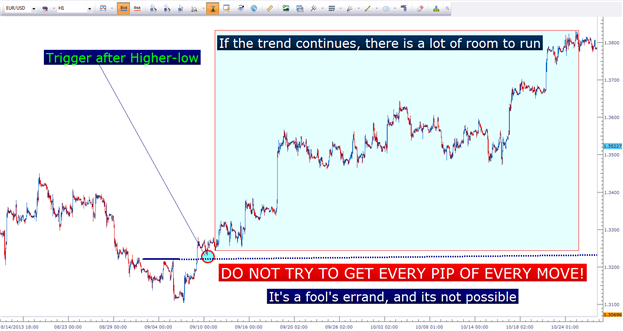
Created with Marketscope/Trading Station II
The trend continued… and the trader doesn’t even have to take the risk of taking a position during Non-Farm Payrolls…
How to Combine Fundamentals and Price Action
Look at fundamental data announcements as a double-barreled shotgun of risk; not only do you not know what the print will be, but even if you did – you have no clue how traders will price it. So, stop guessing, and put away your crystal balls. Focus on the few things that you KNOW for a fact.
- Data announcements bring volatility
- Prices can move higher, or they can move lower
- The only tool we have control of, as traders, is when we buy and when we sell (risk-reward)
Traders can look at data announcements as ‘surprises.’ And surprises can be good or bad. In markets, surprises can hurt you or they can help you. So, if trading around data – be sure to put yourself in situations in which surprises can help you more than they might hurt you (by looking for favorable risk-reward ratios).
Traders can then look to utilize price action to trade in the direction of the general trend, and this does a few things.
If a fundamental theme is taking place, such as increasing optimism in Europe – how do you think that will show up on the chart?
Price Action will show an up-trend, with higher-highs, and higher-lows printed by the currency pair. So, in the above chart of the EURUSD, much of the movement that took place after that September 6th NFP print wasn’t even in direct relation to the release of non-farm payrolls. Rather, it was the market changing course, and NFP was simply that catalyst.
Going into NFP, traders were selling the EURUSD; then NFP happened, and more buyers came in than sellers. This provided a stimulus to prices that eventually evoked a 600+ pip uptrend.
But it’s not enough to simply buy in an up-trend, or sell in a down-trend; rather – we need to do so efficiently and price action can be a great assistant.
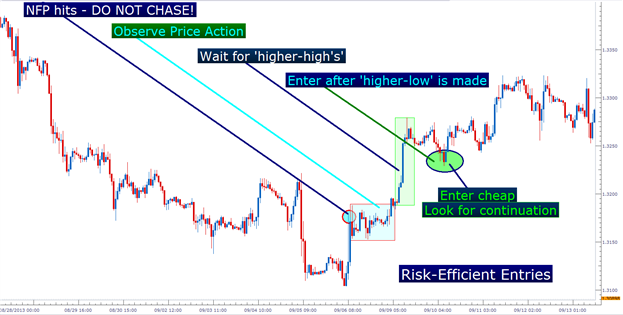
As we saw in The Forex Trader’s Guide to Price Action, traders can look to trade up-trends buy buying the ‘higher-low’ or shortly after one is printed in the market. The example below is a zoomed-in view on the EURUSD trend that we’ve been discussing:
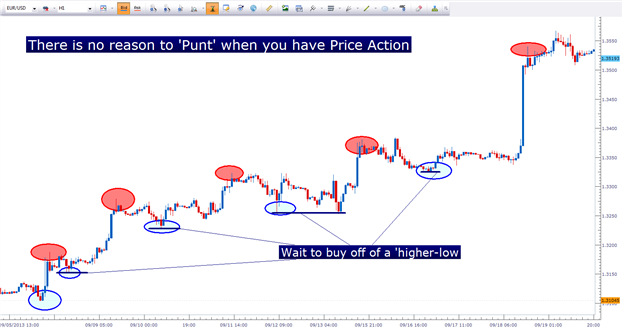
Created with Marketscope/Trading Station II
After this up-trend has set in the market, the trader can simply wait with the objective of initiating the long position as cheaply as possible. After a ‘higher-low’ has established itself in the up-trend, the trader can look to trigger with a stop just below the low.
If that ‘higher-low’ doesn’t hold, you might not want to be in that long position anymore anyways, because the up-trend you were looking to trade in was violated, and we could then be seeing a reversal.
So, this strategy allows you to enter the position cheaply with a stop below the ‘higher-low,’ and then you can look for a big move if the trend continues.
Price Action Primer via Brainshark
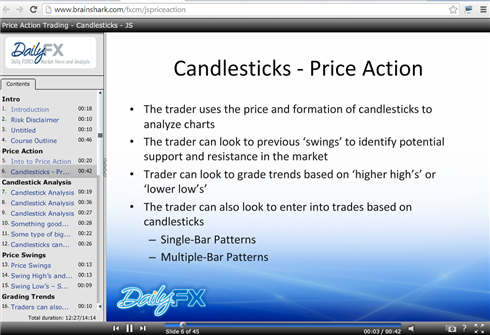
Image taken from Price Action Primer – www.brainshark.com/FXCM/jspriceaction
-- Written by James Stanley
James is available on Twitter @JStanleyFX
We’ve recently begun to record a series of Forex Videos on a variety of topics. We’d greatly appreciate any feedback or input you might be able to offer on these Forex videos:


