


New traders often learn a valuable lesson very early in their trading career. And that is that any trade idea is often – at best – a hypothesis.
Any trade that is placed can be a potential loss, and the management of risk is important regardless of the market, currency pair, or asset class being traded; so that if that loss occurs – the trader is able to mitigate the damage.
Traders can attempt to ‘cap,’ or mitigate losses with the usage of stop-loss order. A Stop-Loss is a protective order added to a trade; a order that will close the position if price moves against the trader.
There are not as many indicators designed for risk management, or stop placement as there are for other facets of trading, such as entering trades – but there is one indicator that traders can look to for suggested risk management that is known as Parabolic SAR.
Parabolic SAR (which stands for STOP and REVERSE) is an indicator designed by J. Welles Wilder with the goal of denoting market trends.
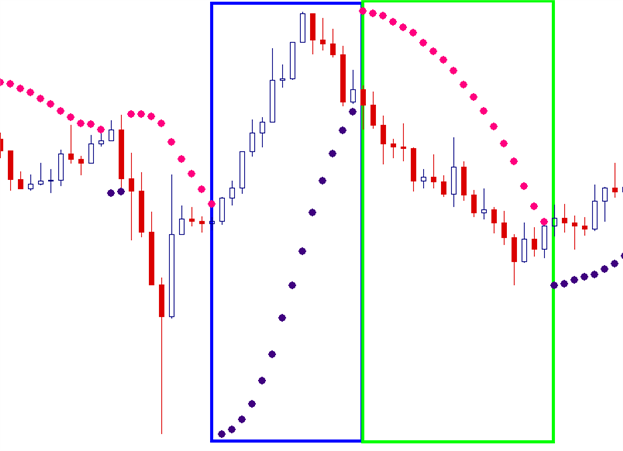
Below is a chart with Parablic SAR applied (using the default inputs of .02 step and .2 limit). Please notice the area encompassed by the box outlined in blue.

Created by James Stanley
In the blue box, the market began trending up. Also, please notice the purple dot added towards the bottom of the blue box, sloping higher as price continued to trend in an upward direction. As the currency pair continued its trajectory higher, Parabolic SAR was plotted below price.
Towards the top of this up-trend, price began to come down. As price fell further, price eventually intersected with where Parabolic SAR was plotted. A closer view is added below:

Created by James Stanley
In the Yellow circle, we can see the intersection of price with the Parabolic SAR plot. The candle immediately following the intersection, then plots ABOVE price, indicating bearishness. Now as price continues to move lower, Parabolic SAR is plotted above price until another intersection takes place. Let’s look at the first picture again to see both a Bullish and Bearish Parabolic SAR reading.
Created by James Stanley
The Green box in the picture above will show us the bearish downtrend that followed the intersection of price and Parabolic SAR that we had looked at previously (highlighted by the yellow circle).
Once again, as the trend continues, so does Parabolic SAR – continuing to denote the bearish downtrend with plots ABOVE price.
Towards the end of the Green box, we, once again, see an intersection of price with the Parabolic SAR plot ABOVE price. The indicator will then switch sides with which it is plotted, and begin printing underneath price in a BULLISH fashion.
As you may have noticed, Parabolic SAR is always plotted on the chart. Values are dictated solely by price movements relative to previous price movements, and Parabolic SAR will always be either bullish or bearish.
One of the more popular mechanisms of utilizing Parabolic SAR is for risk management, or the setting of stops. Traders looking to trade with long-term trends can look to place their stops at the area in which Parabolic SAR is plotted. If the trend continues, the trader can continually adjust the stop higher per the reading of the indicator. As the indicator continues to print higher, this gives the trader the potential to move their stop beyond break-even, locking up gains as the position moves in the traders’ favor.
Eventually, when price retraces and crosses the Parabolic SAR plot, the trader can look to close out their trade (hopefully at a hearty gain) in anticipation of a potential trend change against the trader’s initial position.
Next: Trading the Rate of Change Indicator (22 of 50)
Previous: The ADX Indicator Is a Power Tool for Trading Trends
Additional resources regarding Stop Placement:
James Stanley contributes to the Instructor Trading Tips of DailyFX.
You can follow James Stanley on Twitter @JStanleyFX.
To join James Stanley’s distribution list, please click here.


