


This is the second piece of the How to trade Support and Resistance. In the first article, we established the benefits of support and resistance and how it can provide clues to us about the market supply and market demand of the currency pair. Today’s article will show you how you can use the levels of support and resistance to determine market direction and time your entries.
Today we are going to draw trend lines on the chart. The first thing to remember is that drawing the lines is more of an art than a science. Where you draw the trend line may not be the exact place where I draw the trend line. To determine where the line gets placed, look for 2 common points within a chart.
Determining Buy Signals
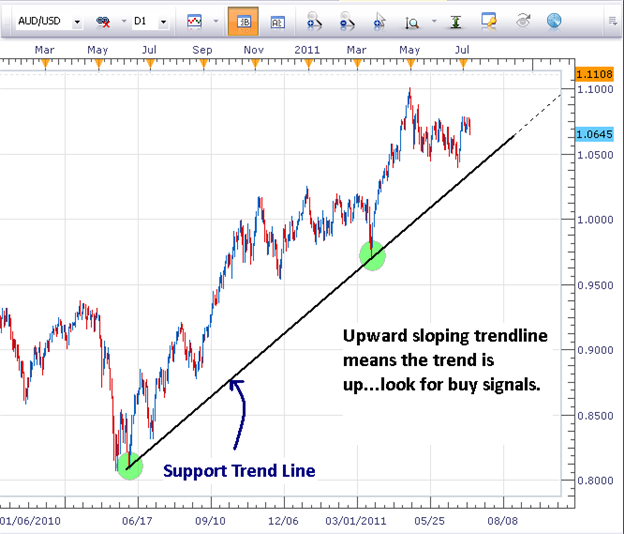
Here is a daily chart for the AUDUSD. I’m simply connecting the 2 low points at the green circles. An effective support trend line (up trend line) is effective when it is placed on the lows of wicks of the candles. After drawing the line, I now have 2 pieces of information to help me in my trade.
*Since the trend line is sloping upward, my trend direction is upward
*Use this trend line to generate buy signals into this pair
In an uptrend, once the trend line is established, a new long position can be taken when price action trades down to support and respects the support so that a candle body does not close below it. Once prices have touched the support and the candle has closed above it, we have a valid buy signal.
Determining Sell Signals
Here is a daily chart for the USDCHF. Connect the common swing highs (pink circles) to form a resistance trend line. In this case, prices have just touched the resistance line for the 4th time. The more times a line is touched, the weaker it becomes so the best time to trade trend lines is on the 3rd and 4th touch of the lines.
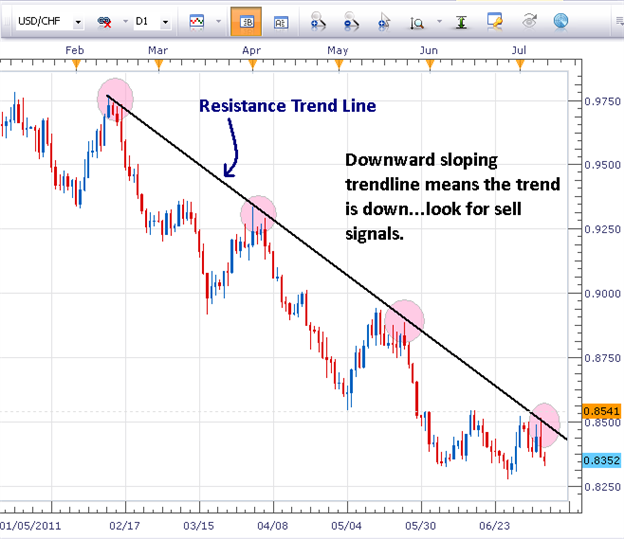
*Since this trend line is sloping downward, the trend of the pair is down and we want to filter our trades looking for sell signals.
*Use this resistance trend line to generate sell signals into this pair.
In a downtrend, once the trend line is established, a new sell position can be taken when price action trades up to resistance and respects the resistance line so that a candle body does not close above it. Once prices have touched the resistance line and the candle has closed below it, we have a valid sell signal.
Next: Price Action Pin Bars (33 of 47)
Previous: How to Use Trendline Support or Resistance to Enter a Trade
Learn how to identify support and resistance levels in real time with live webinars. We offer several live webinars on the topic of support and resistance. Our instructors will share with you key levels of support and resistance and how to identify trading opportunities based on those price points.
---Written by Jeremy Wagner, Lead Trading Instructor, DailyFX Education
To contact Jeremy, email jwagner@dailyfx.com. Follow me on Twitter at @JWagnerFXTrader.
To be added to Jeremy’s e-mail distribution list, send an email with the subject line “Distribution List” to jwagner@dailyfx.com.


