


Talking Points:
- Crude Oil Prices Break Down Intraday
- Daily Resistance Found at $54.64; Support Found at $53.67
- Looking for additional trade ideas for Crude Oil & Commodities? Read our 2017 forecast
Crude oil prices are turning lower this afternoon, putting last week’s bullish price trend in jeopardy. Currently the commodity is trading back below its 10 day EMA (exponential moving average) at $53.70. This move suggests that short term momentum for the commodity is technically turning bearish. If prices continue to decline, traders will next look for crude oil to challenge the January 31st swing low found at $52.52.
Alternatively, if prices find support intraday, traders will look for prices to close back above the previously mentioned moving average. A bullish bounce would label today’s price action as a higher low in a developing uptrend. In this scenario, traders may look for crude oil to rally and challenge last week’s high of $54.64.
Crude Oil Price Daily Chart with Averages
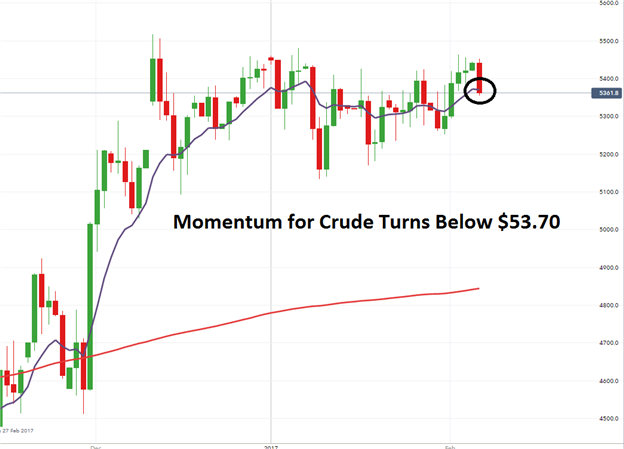
(Created Using IG Charts)
Intraday analysis has crude oil prices breaking out below support of a multi-day range. The range, as displayed below, has been developing since Thursday. It has been comprised by using $54.64 as a point of resistance and 53.67 as support. Traders looking for initial bearish pricing targets may consider use a 1x extension of this $0.97 range, placing targets near $52.70.
In the event of a late day bullish reversal, traders should look for crude oil to re-enter the previously described trading range. A move of this nature would label this afternoon’s price action as a false breakout, and potentially place the commodity back above its 10 day EMA. Traders should note, that a continued rally may see prices break back above $54.64. Again traders may extrapolate a 1x extension of the range to place bullish breakout targets near $55.61.
Crude Oil Price 30 Minute Chart with Range

(Created Using IG Charts)
--- Written by Walker, Analyst for DailyFX.com
To Receive Walkers’ analysis directly via email, please SIGN UP HERE
See Walker’s most recent articles at his Bio Page.
Contact and Follow Walker on Twitter @WEnglandFX.


