


Talking Points:
- Crude oil prices stall as traders wait for FOMC minutes
- The US Dollar continues to be a focus for commodities trader
- FOMC meeting minutes may increase market volatility
Crude oil prices are moving lower, after initially trading to an 18 month high to start 2017. Despite an agreement for a supply cut by OPEC, the major fundamental facing crude oil prices remains the US Dollar. The DXY (US Dollar Index) is now trading off of 15 year highs, and if this trend continues commodity prices may continue to slide through Q1 of 2017. In focus for this afternoon is today’s release of the FOMC meeting minutes for December. Depending on how this event is interpreted, traders should look for volatility to pick up across markets later in today’s session.
DXY Monthly Chart & 200 MVA
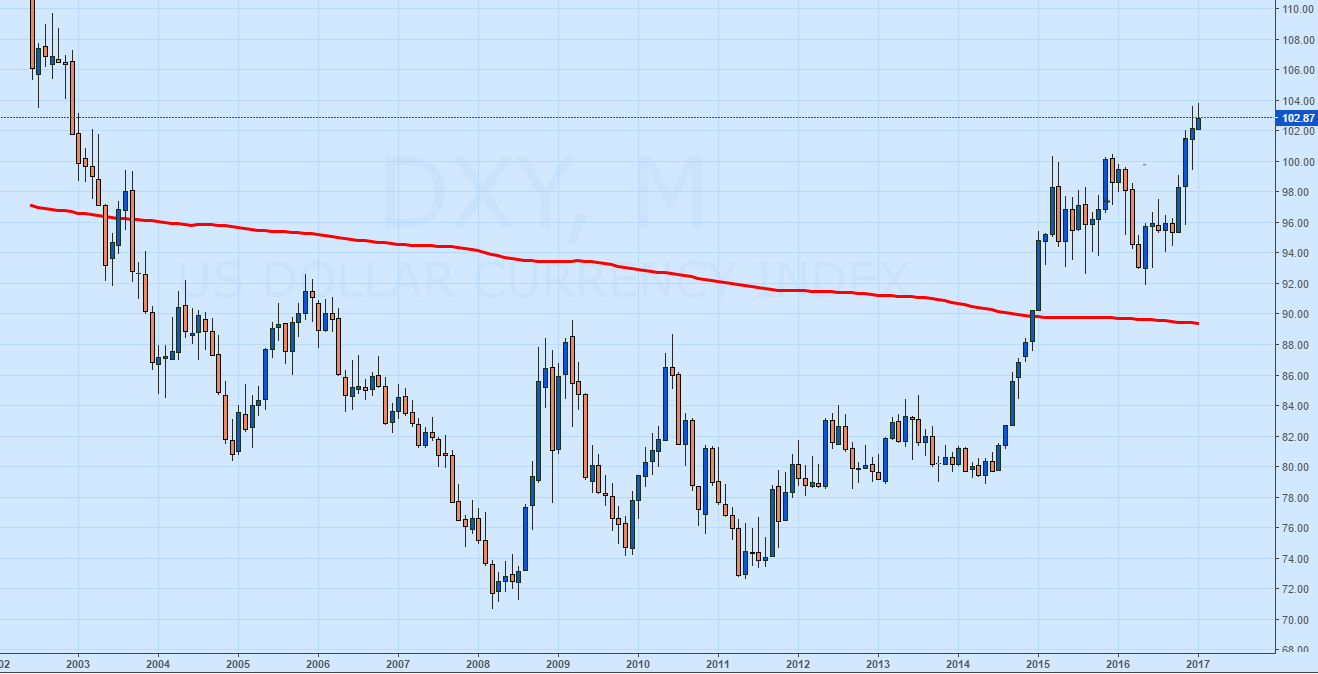
(Created Using TradingView Charts)
Looking for additional trade ideas for Oil and Commodities Markets? Read Our 2017 Market Forecast
Technically, crude oil remains range bound between key values of intraday support and resistance ahead of today’s event. Today’s range is graphically displayed below between the R3 pivot and S3 pivot, found at $53.31 and $51.59 respectfully. In a Dollar strong environment, traders may look for crude to test this initial value of support, before trying to break below the final value of intraday support at $50.73. A breakout below $50.73 should be seen as significant, and would place the commodity under the October 2016 high of $51.91.
If prices do rise on a weaker US Dollar, bullish breakouts for crude may be signaled above $54.14 intraday. A move of this nature may stymie and earlier seen bearish momentum, and allow prices to then challenge the standing 2017 high at $55.21.
Crude Oil 30 Minute Chart with Pivots

(Created Using TradingView Charts
--- Written by Walker, Analyst for DailyFX.com
To Receive Walkers’ analysis directly via email, please SIGN UP HERE
See Walker’s most recent articles at his Bio Page.
Contact and Follow Walker on Twitter @WEnglandFX.


