


Talking Points:
- AUD/USD Declines From Weekly Highs
- Daily Support is Found near .7587
- Looking for additional trade ideas for the AUD/USD and other Dollar pairs? Check out our Dollar Trading Forecast
After spiking as much as 74 pips to form a weekly high in yesterday’s trading, the AUD/USD is now declining back towards values of daily support. Support for the pair is currently represented in the graph below as the October 21 low, found at a price of .7587. If the AUD/USD remains supported here, it may suggest that the pair is trading in a developing descending triangle. Technically, this triangle formation may suggest a rebound in the currency pair back towards the displayed line of declining resistance. Alternatively, a breakout lower in the short term, may suggest a broader shift in the AUD/USD daily trend.
AUD/USD Daily Chart, Descending Triangle
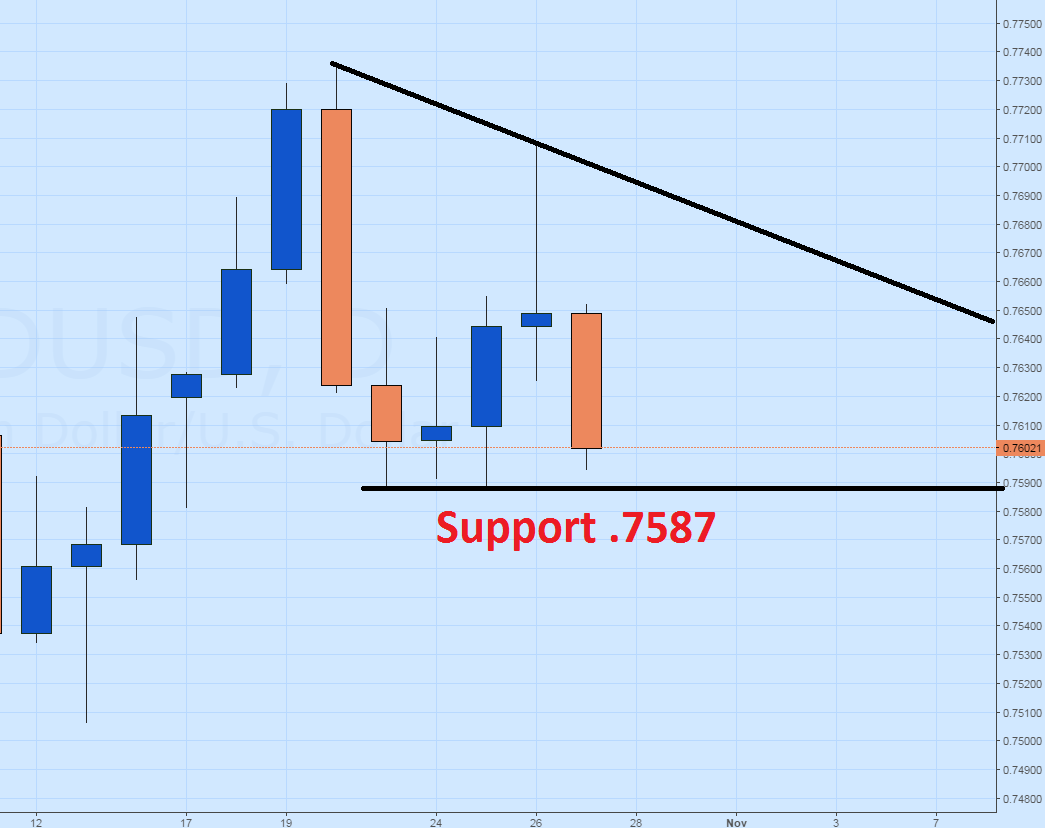
(Created using TradingView Charts)
As the AUD/USD continues to trade off of daily lows, traders may look to short term momentum cues to help decipher the pair’s next directional move. Using the 5-minute graph below, the Grid Sight Index (GSI) has identified a short-term downtrend developing in the last two hours of trading. Also after reviewing 69,296,022 pricing points, GSI has indicated that price action has continued to decline by 15 pips or more in 34% of the reported 44 matching historical events. With such a small percentage of historical values pointing lower, it may suggest that the AUD/USD is consolidating before its next breakout or may point towards a late day retracement. It should be noted that today’s first bearish historical price distribution is found at .7582. If the AUD/USD does reach this point, it may suggest a resumption of the trend with daily support at .7587 being broken.
Alternatively, GSI has indicated that prices have increased by 16 pips or more in 48% of the identified 44 historical instances. With less than half of historical instances pointing higher, this may again suggest further AUD/USD consolidation. However if the AUD/USD advances through .7613 or higher, it may suggest the beginning of a bullish retracement for the pair.

To Receive Walkers’ analysis directly via email, please SIGN UP HERE
See Walker’s most recent articles at his Bio Page.
Contact and Follow Walker on Twitter @WEnglandFX.


