


Talking Points
- Gold Prices Remain Bearish; Decline For 8th Session
- Intraday Support for Gold Found Near $1,250.00
- Looking for additional trade ideas for Gold? Check out our Gold Trading Guide
Nothing appears to be able to stem the decline in Gold prices as the commodity is set to close lower for the 8th consecutive trading day. This dramatic drop has been fundamentally advanced by traders expecting U.S. interest rates to rise before the end of the year. Gold traders will continue to monitor prices through tomorrows NFP event, expecting that the outcome may affect the FED’s upcoming rate decision. Technically, long term charts are now testing support above $1,250.00. A break below this value may have serious implications for Gold, as prices would then be open next test the June 2016 low at $1,199.50. Alternatively, traders may monitor short term trends to evaluate if any semblance of a rebound is in order.
Gold Prices 1 Day, Support $1,250.00
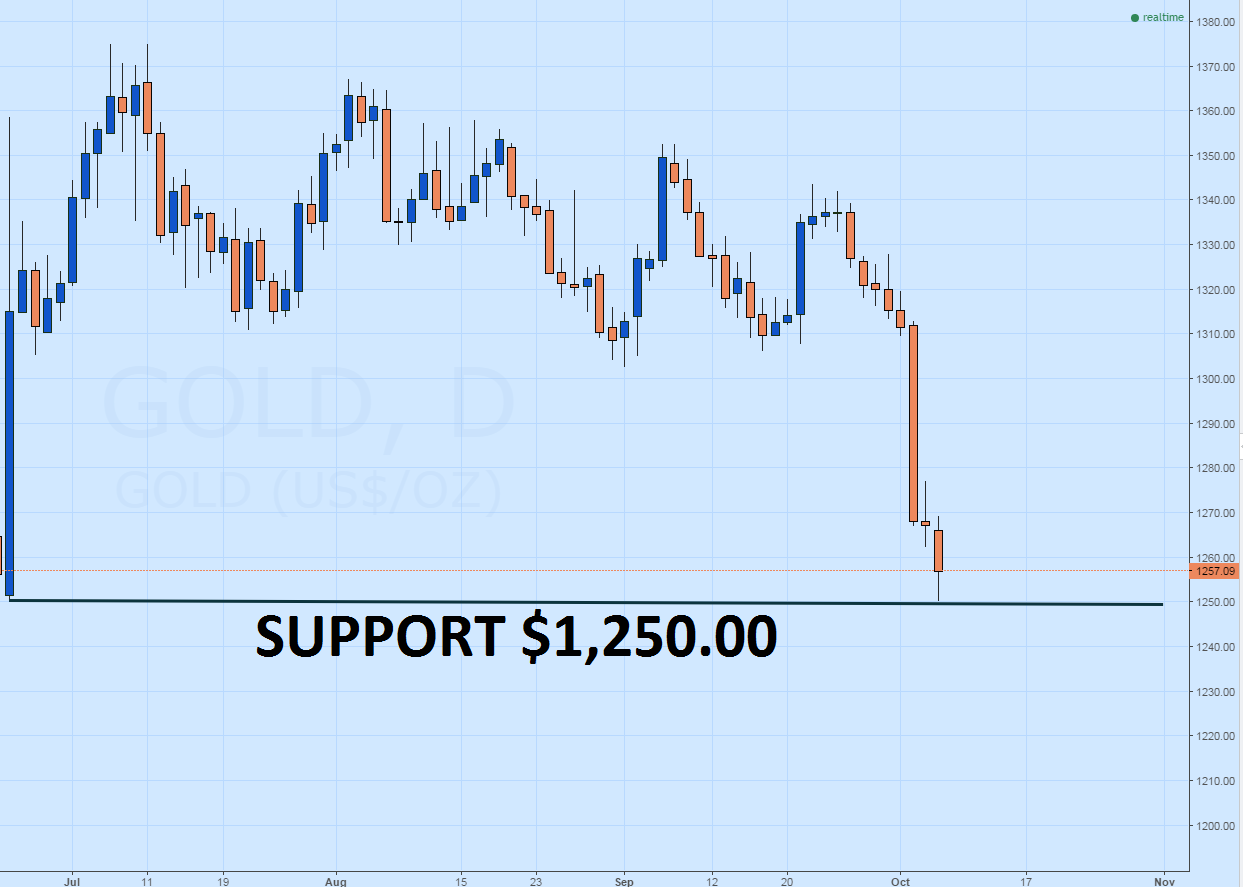
(Created using TradingView Charts)
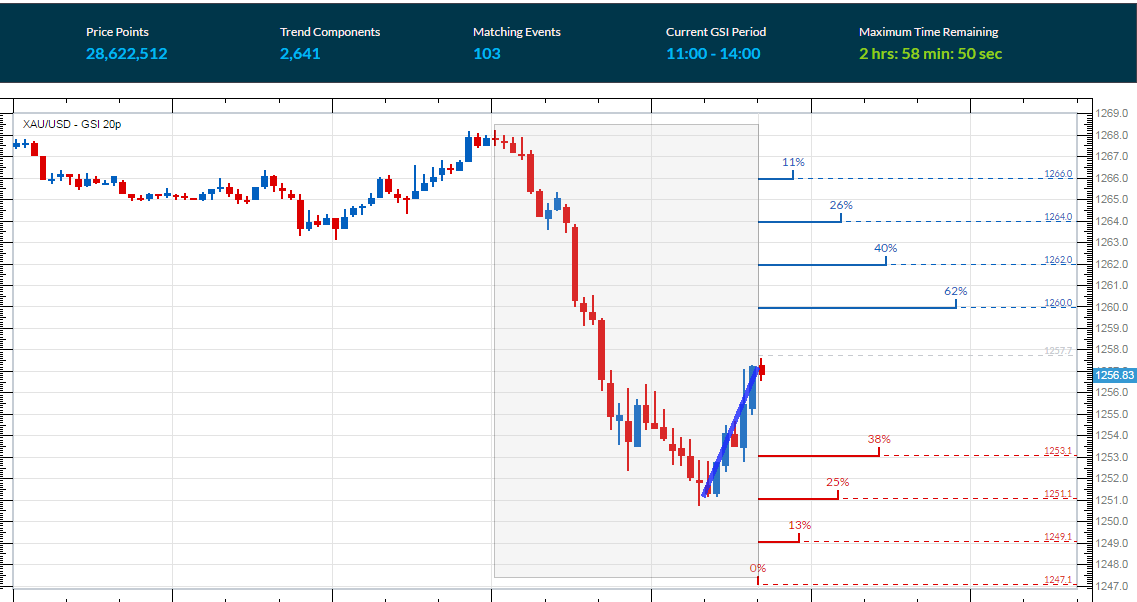
Referencing the 10 minute graph below, the price of Gold can be seen trending lower. The Grid Sight Index (GSI) has picked up on a short term uptrend however, by identifying a series of higher highs created in the last 2 hours of trading. After reviewing 28,622,512 pricing points, GSI has also indicated that price action has continued to increase by $1.30 or more in 62% of the reported 103 matching historical events. This places the first historical bullish price distribution at $1,260.00. If Gold prices trade through this value, it may suggest that the commodity remains at least temporarily supported above support.
Alternatively, GSI has indicated that prices have declined by $4.60 or more in 38% of the identified historical instances. This places the first bearish historical distribution at a price of $1,253.10. A move through this point would signal a shift in momentum back in the direction of Golds primary trend. In this scenario, traders may look for new breakout opportunities beneath the existing daily low.
To Receive Walkers’ analysis directly via email, please SIGN UP HERE
See Walker’s most recent articles at his Bio Page.
Contact and Follow Walker on Twitter @WEnglandFX.


