


Talking Points
- Gold Prices Trade Under Channel Resistance Near $1,327.00
- Short Term Prices Bounce from Morning Lows at $1,318.33
- If you are looking for more trading ideas for Gold check out our Trading Guides
The price of Gold continues to channel as prices have failed to breakout to a new significant high or low ahead of this week’s FOMC rate decision. The FOMC is expected to keep rates unchanged at 0.50%, but any deviation from this policy may have drastic effects on both the US Dollar as well as Gold. As such, traders should continue to monitor both channel resistance, which resides near $1,327.00 and support near $1,300.00
GOLD, 4 Hour Chart
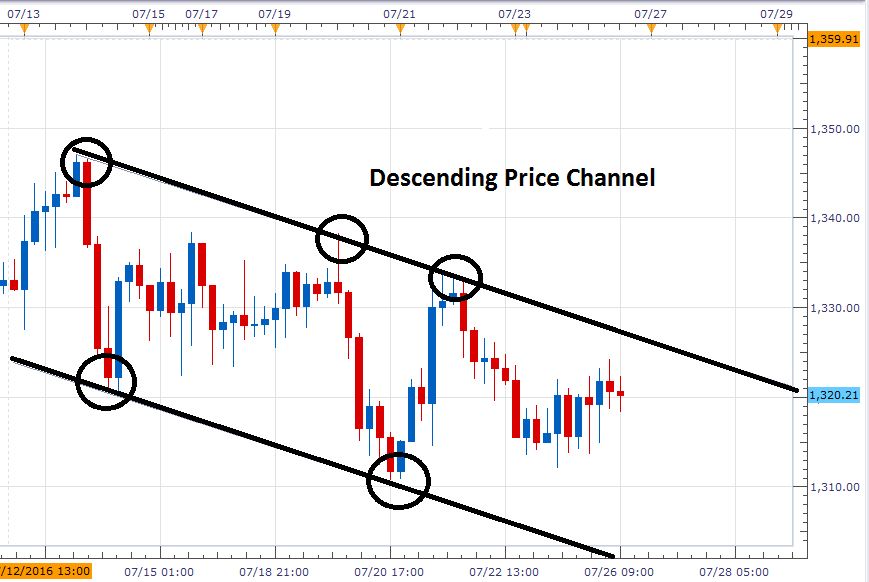
(Created by Walker England)
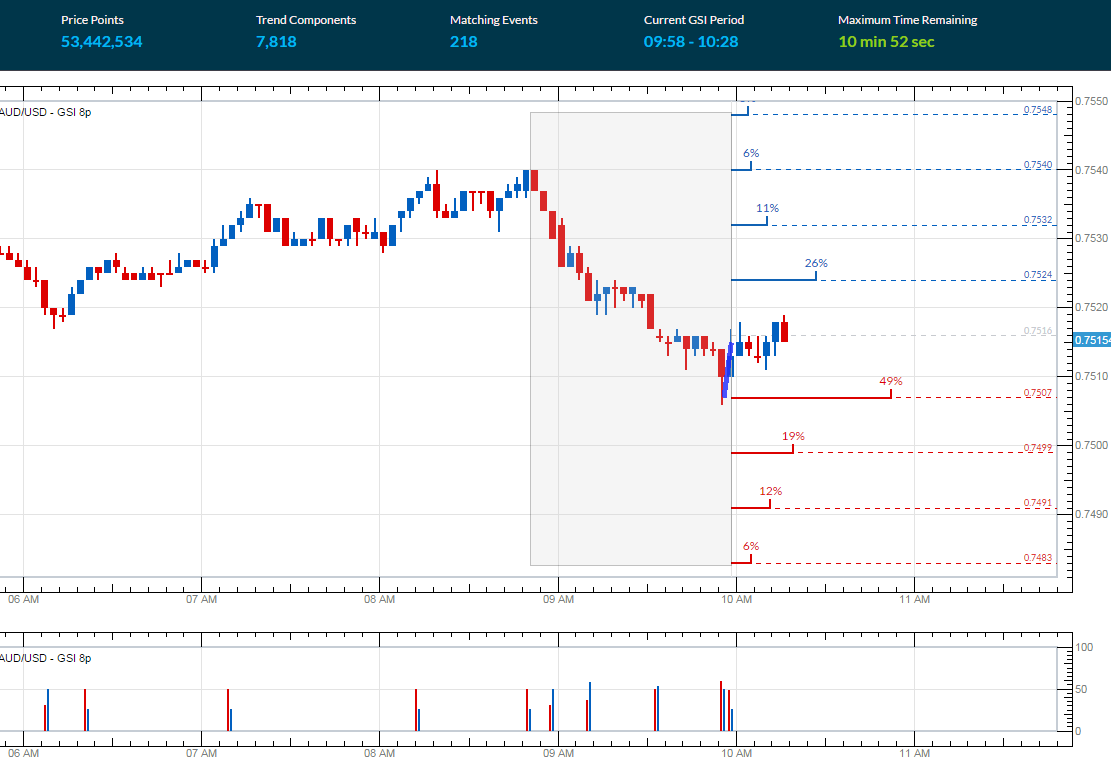
In the 5-minute graph below, we can see short-term price action for gold trading off of this morning’s U.S. session low at 1,318.33. The Grid Sight Index current momentum with the creation of a series of higher lows over the last hour of trading. After reviewing 41,146,827 pricing points, GSI has also indicated that price action has advanced by a minimum of $1.40 in 57% of the 833 matching historical events. The first historical distribution line lies at $1,322.20. A move to this value would put the price of gold just under channel resistance. At this point momentum should be reevaluated, as price action may breakout higher, or reverse back towards channel support.
It should be noted that the first bearish historical distribution currently resides at $1,318.00. The Grid Sight Index found that prices declined $2.00 or more in just 23% of the matching 833 historical matching events. A move through this value would suggest new bearish momentum emerging for Gold prices. Ultimately, if prices continue to trade lower, traders may begin to focus on the channel low near $1,300.00.
Want to learn more about GSI? Get started learning about the Index HERE.
Gold 5 Minute GSI Chart
Sentiment for Gold (Ticker: XAU/USD) is positive with SSI reading at +1.43. With 59% of positioning long, this is typically taken as a bearish signal. In the event of further price declines in Gold, traders should look for SSI to move towards positive extremes of +2.00 or greater. Alternatively, if price action breaks higher, traders may look for SSI readings to neutralize.
To Receive Walkers’ analysis directly via email, please SIGN UP HERE
See Walker’s most recent articles at his Bio Page.
Contact and Follow Walker on Twitter @WEnglandFX.


