


Talking Points
- Crude Oil Prices Consolidate for 5th Session
- Short Term Momentum for Crude Oil Points Higher
- If you are looking for more trading ideas for Oil and Commodities, check out our Trading Guides
The price of WTI Crude Oil (CFD:USOil) has failed to make any significant technical developments so far this week. Crude Oil prices are currently consolidating inside of the July 12 daily candle for the 5th consecutive trading session. As displayed below, the July 12 high is currently acting s resistance for Crude Oil at a price of $46.90. Alternatively, support may be found at the daily low, at a price of $44.47. Traders should continue to monitor these points, to watch for the markets next chosen direction.
WTI Crude Oil Price, Daily Chart
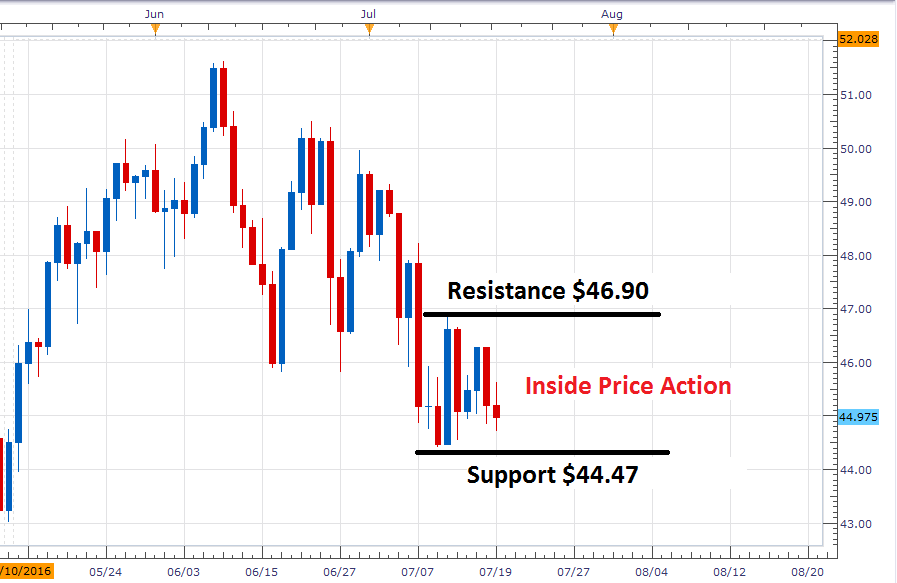
(Created by Walker England)
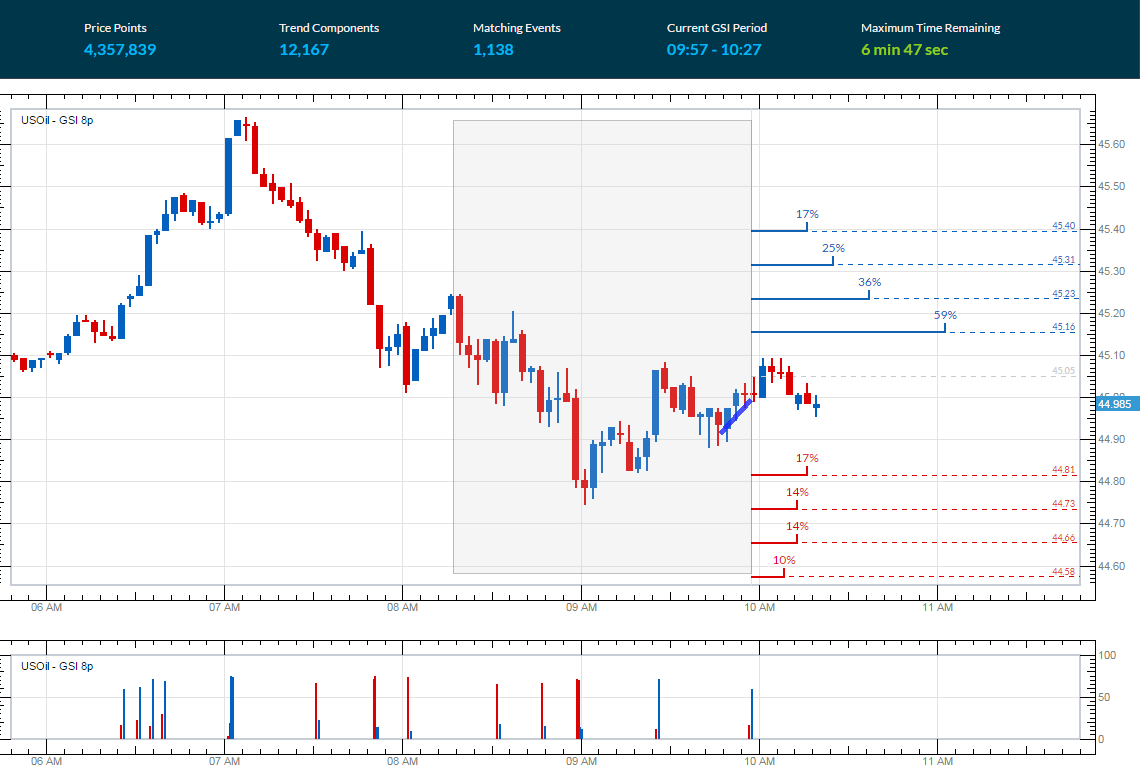
In the graph below, we can see Crude Oil prices closing in on the previously mentioned daily low. Despite this retracement in price, so far, Crude Oil has remained supported and the Grid Sight Index has pinpointed a short-term uptrend developing. After reviewing 4,357,839 pricing points, GSI has indicated that price action has declined by a minimum of 24 cents in just 17% of the 1,138 matching historical events. If prices fail to trade through this first bearish distribution at $44.81, it may suggest that prices may bounce towards support. Today’s first bullish distribution is found at $45.16. In 59% of the recorded matching events, prices rose 11 cents in 59% of instances. A move through this point may also suggest a return towards price resistance at $46.90.
Of the matching historical outcomes, prices declined 47 cents in just 10% of instances. Traders looking for a bearish breakout should continue to monitor this value, as it would signify a significant shift in Crude Oil prices for the day.
Want to learn more about GSI? Get started learning about the Index HERE.
WTI Crude Oil (UsOil) 3 Minute GSI Chart
Sentiment for WTI Crude Oil (Ticker: USOil) continues to read flat with SSI (speculative sentiment index) reading at +1.08. With positioning nearly split between long and short positions, this may indicate continued consolidation for Crude Oil. In the event that Crude Oil prices break lower, traders may look for SSI to move towards a positive extreme. Alternatively, if Oil breaks above resistance, SSI may flip back to a negative reading.

To Receive Walkers’ analysis directly via email, please SIGN UP HERE
See Walker’s most recent articles at his Bio Page.
Contact and Follow Walker on Twitter @WEnglandFX.


