


Talking Points
- AUD/USD Stalls Under Resistance Ahead of U.S. Retail Sales Figures
- AUD/USD Bearish Distributions Begin at .7641 / Bullish .7658
- If you are looking for more trading ideas for US Dollar Pairs, check out our Trading Guides
The AUD/USD has stalled under key resistance found at .7687. This value represents on the graph below as a 78.6% Fibonacci retracement, measured from the April high at .7835 to the May low of .7145. If price action fails to break through this value, it may suggest a turn in price and an end to July’s current uptrend. Alternatively, a breakout above this point will expose April’s highs which is currently the standing high for the 2016 trading year.
AUD/USD, Daily Chart
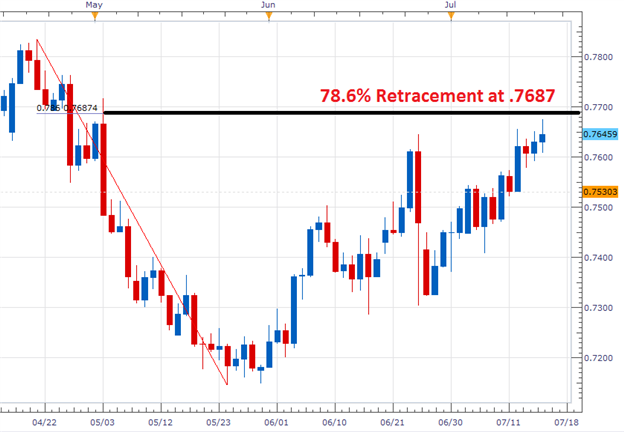
(Created by Walker England)
Going into this morning’s U.S. open, traders will be waiting for the release of U.S. Retail Sales figures. Estimates for the event stand at 0.1%, and any deviation may cause a change in momentum for US Dollar pairs. To get an Idea of where the AUD/USD stands ahead of the news, GSI has evaluated 46,266.635 4,249,087 pricing points. This indicator has shown that out of the 114 matching historical events prices have declined by a minimum of 9 pip in 50% of these instances. This places today’s first bearish distribution at a price of .7641. A move to this value would be significant as it would help validate the AUD/USD price rejection at the previously mentioned Fibonacci line.
Of the matching historical outcomes, prices advanced 32 pips in only 5% of instances. A bullish move of this nature would place the AUD/USD at .7682. In this scenario, price action would be just shy of the retracement value at .7687, at which point traders may reevaluate planning for a breakout.
Want to learn more about GSI? Get started learning about the Index HERE.
AUD/USD 5Minute GSI Chart

What is GSI?
Grid Sight Index is a powerful big data indicator that can help you determine whether short-term trends will continue or reverse. GSI takes a snapshot of current price action and uses that to find similar events by studying millions of historical data points. Then it studies those events to show you how often the trend continued or reversed in the past.
To Receive Walkers’ analysis directly via email, please SIGN UP HERE
See Walker’s most recent articles at his Bio Page.
Contact and Follow Walker on Twitter @WEnglandFX.


