


Talking Points:
*Understanding Measured Moves
*How Measured Moves Can Improve Your Trading
*USDOLLAR Correction Is Coming To A Measured Move Target
“There is nothing new on Wall Street or in stock speculation.What has happened in the past will happen again, and again, and again. This is because human nature does not change, and it is human emotion, solidly build into human nature that always gets in the way of human intelligence. Of this I am sure.” (Emphasis mine)
-Jesse Livermore
Every time a crisis comes around, you often hear the words, ‘this time it’s different’. However, the beauty of technical analysis is that the emotions behind the price often play out in a similar manner as they do historically because human nature is as a whole doesn’t vary by much. Therefore, whether you’re looking at the Panic of 1907, the Wall Street Crash of 1929, Black Monday in 1987, the 1997 Asian Financial Crisis, or the 2008 Subprime mortgage crisis the emotions behind those ‘history altering events’ were similar.
Understanding Measured Moves
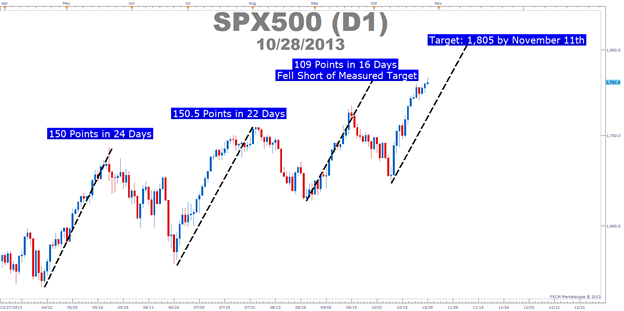
One old school price action concept that holds weight today is that of the measure move. The measured move states that any given trading instrument will often impulse or correct in similar price & time pattern to how it performed in recent history. This can be applied to both time and price as the distance travels is often similar and the time it takes to reach that point is strikingly similar as well.
Learn Forex: Measured Moves in Time & Price As Shown on SPX500
What is surprising about this type of price action is in the witnessing of market rhythm. With market rhythm all the fundamental forces are still in play like CPI, NFP, FOMC and everything else that can steer and pull prices but the effect of those news events are often limited to the rhythm of historic price action. This would be similar to finding a distinct pattern in the road so that even if you were blindfolded and driving (which I don’t recommend!), you could begin to sense when you should begin preparing for the next turn.
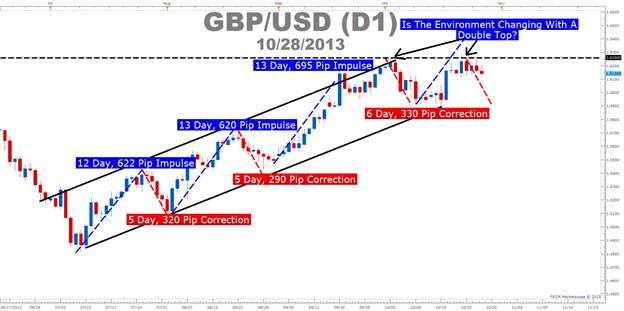
Learn Forex: The GBPUSD Channel has displayed strikingly similar impulses & corrections
How Measured Moves Can Improve Your Trading
There are multiple ways that measured moves can assist your trading. The two that I like to utilize the most for trading is in analyzing correction exhaustion and over acceleration or blow off tops of an impulse. Regarding the exhaustion point of a correction before a trend resumes, you’ll often notice that the counter trend crowd will likely only test their efforts so much before taking their risky profits and letting the trend followers take over. When trading with Elliott Wave, this is often known as an equal wave correction which will often precede resumption of the trend.
Learn Forex: Equal Wave Corrections are simply measured moves
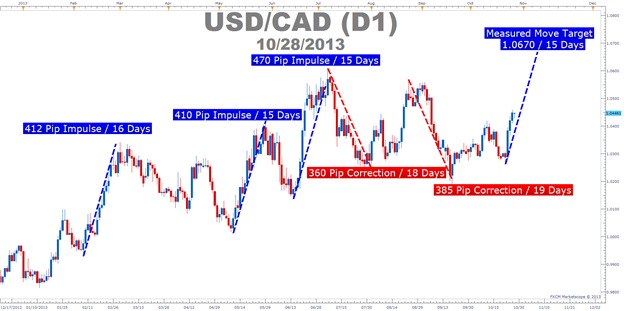
The second time and price aspect that I like to look for takes place when price has met the measured move objective but the market has far exceed the common time taken in prior impulses to hit the price target. When this happens, you’ll often see a measured move of 250 pips in 12 days reach a target of 250 pips in 6 days. This typically happens off a news shock like FOMC or NFP that was outside of expectations and then you’ll typically see a strong consolidation in the market until you meet a proper target for a correction like a Fibonacci ratio or a polarity point in the market to resume the trend.
USDOLLAR Correction Is Coming To a Measured Move Target
Since July, the USDOLLAR has been rocked across the board by all of its major counterparts. EURUSD is at 2013 highs, USDCHF is near 2013 lows and the GBPUSD is within an earshot of its 2013 high. As you can imagine, many traders are getting to the point where they feel like the USDOLLAR will continue falling through the floor but the measured moves concept can be of assistance here as well. As the USDOLLAR shows early signs of reversal it is also well within range of 2011 & 2012 corrections.
Learn Forex: Prior Major USDOLLAR Corrections Are In-line with what we’re experiencing
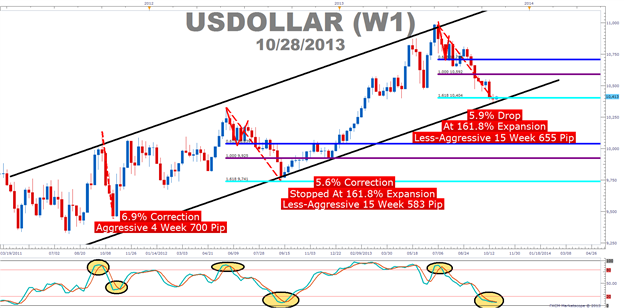
We’re approaching multiple signals that the USDOLLAR is looking for a bottom based on the measured moves technique. However, as we approach these levels or time windows that we’ve seen historically stop a correction, we begin looking at price action to tip its hat that the trend is about to resume via a reversal signal but please do not take a trade blindly on the time or price matching up to a historical level. This technique is very helpful but it isn’t magic so it’s best to look for confirmation before taking the trade.
Happy Trading!
---Written by Tyler Yell, Trading Instructor
To be added to Tyler’s e-mail distribution list, please click here.
If you’d like to combine this lesson with price action signals you can register to take this free 20 minute “Price Action” course presented by DailyFX Education. In the course, you will learn about the basics of price action and how to use the clues the market is providing to place trades.
Register HERE to start your FOREX learning now!


