


Article Summary:The GBPJPY has trended over 1413 pips higher over the past seven months. Today we will look at using PSAR to identify trading opportunities.
Trend traders are always in pursuit of the markets strongest movements. However, once a strong trending currency pair is found, a number of questions are immediately raised. When should I enter the market? At what price level do I begin to look to take profit on my order? Where stops should be placed?
Today we are going to look at trading the GBPJPY with an indicator to help us answer all of the questions mentioned above. Let’s focus our focus our attention to trading with PSAR.
Learn Forex - GBPJPY Daily Trend

Trading with PSAR
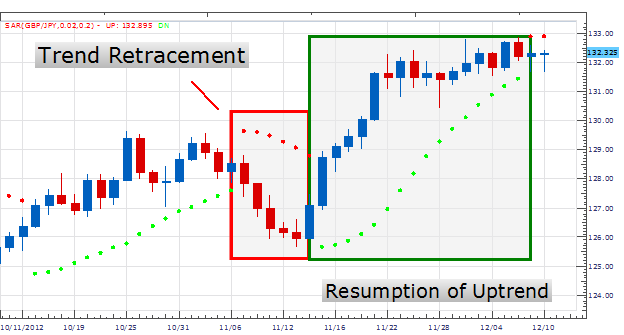
Parabolic Stop and Reverse (PSAR) is a technical indicator intended to assist in finding market momentum. Pictured below, we can see PSAR is created by printing series of red and green dots on our graphs. If we see a red PSAR dot with price trading below it, this is indicative of a downward shift in the market. A green PSAR dot means exactly the opposite, suggesting that the market is swinging higher.
Using PSAR with a trend can be very advantageous. Looking back to our GBPJPY example, traders can wait for a fresh green dot to identify a resumption of its uptrend. The green block in the graph below shows us exactly what a trader with bullish expectations should be looking for. At this point traders may look to take new positions and trade with the primary trend. Traders can keep this bullish expectation until PSAR changes color and a new red PSAR dot appears. This change will occur if price moves against the trend and it is at this point traders should consider managing their position.
Learn Forex -GBPJPY Daily with PSAR
(Created by Walker England)
PSAR For Stops
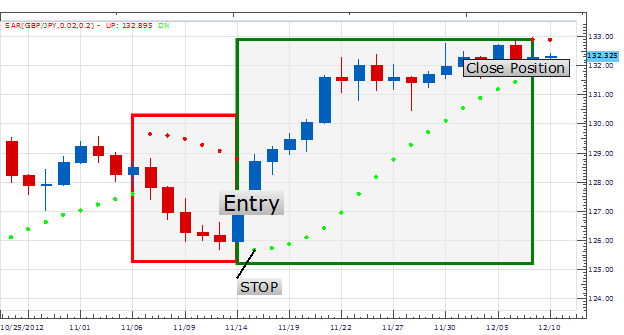
Once an entry is taken, PSAR can also be used to manage risk and lock in profits as a trailing stop. In the GBPJPY daily chart below, an initial stop could be placed at the first green PSAR dot at 125.66. During strong trends traders expect positions to head in a singular direction so traders will have the option to lock in profit as PSAR advances. Each day traders can move their stop forward and lock in profit in increments as PSAR progresses.
In the example below PSAR advanced a total of 16 days before it reversed with a color change. A trader starting their trail at 125.66 would have moved their stop as much as 579 pips to the final green PSAR dot on the graph residing at 131.45. Now since price is trading under PSAR traders will wait for a fresh green PSAR dot to resume trading the GBPJPY and its uptrend.
Learn Forex - Managing Risk with PSAR
(Created by Walker England)
---Written by Walker England, Trading Instructor
To contact Walker, email WEngland@DailyFX.com.
Follow me on Twitter at @WEnglandFX.


