


Gold, Retail Trader Positioning, Technical Analysis – IGCS Update:
- Gold prices on course for best week since March
- Retail trader bets are now shifting more bearish
- A Death Cross remains in play on daily chart

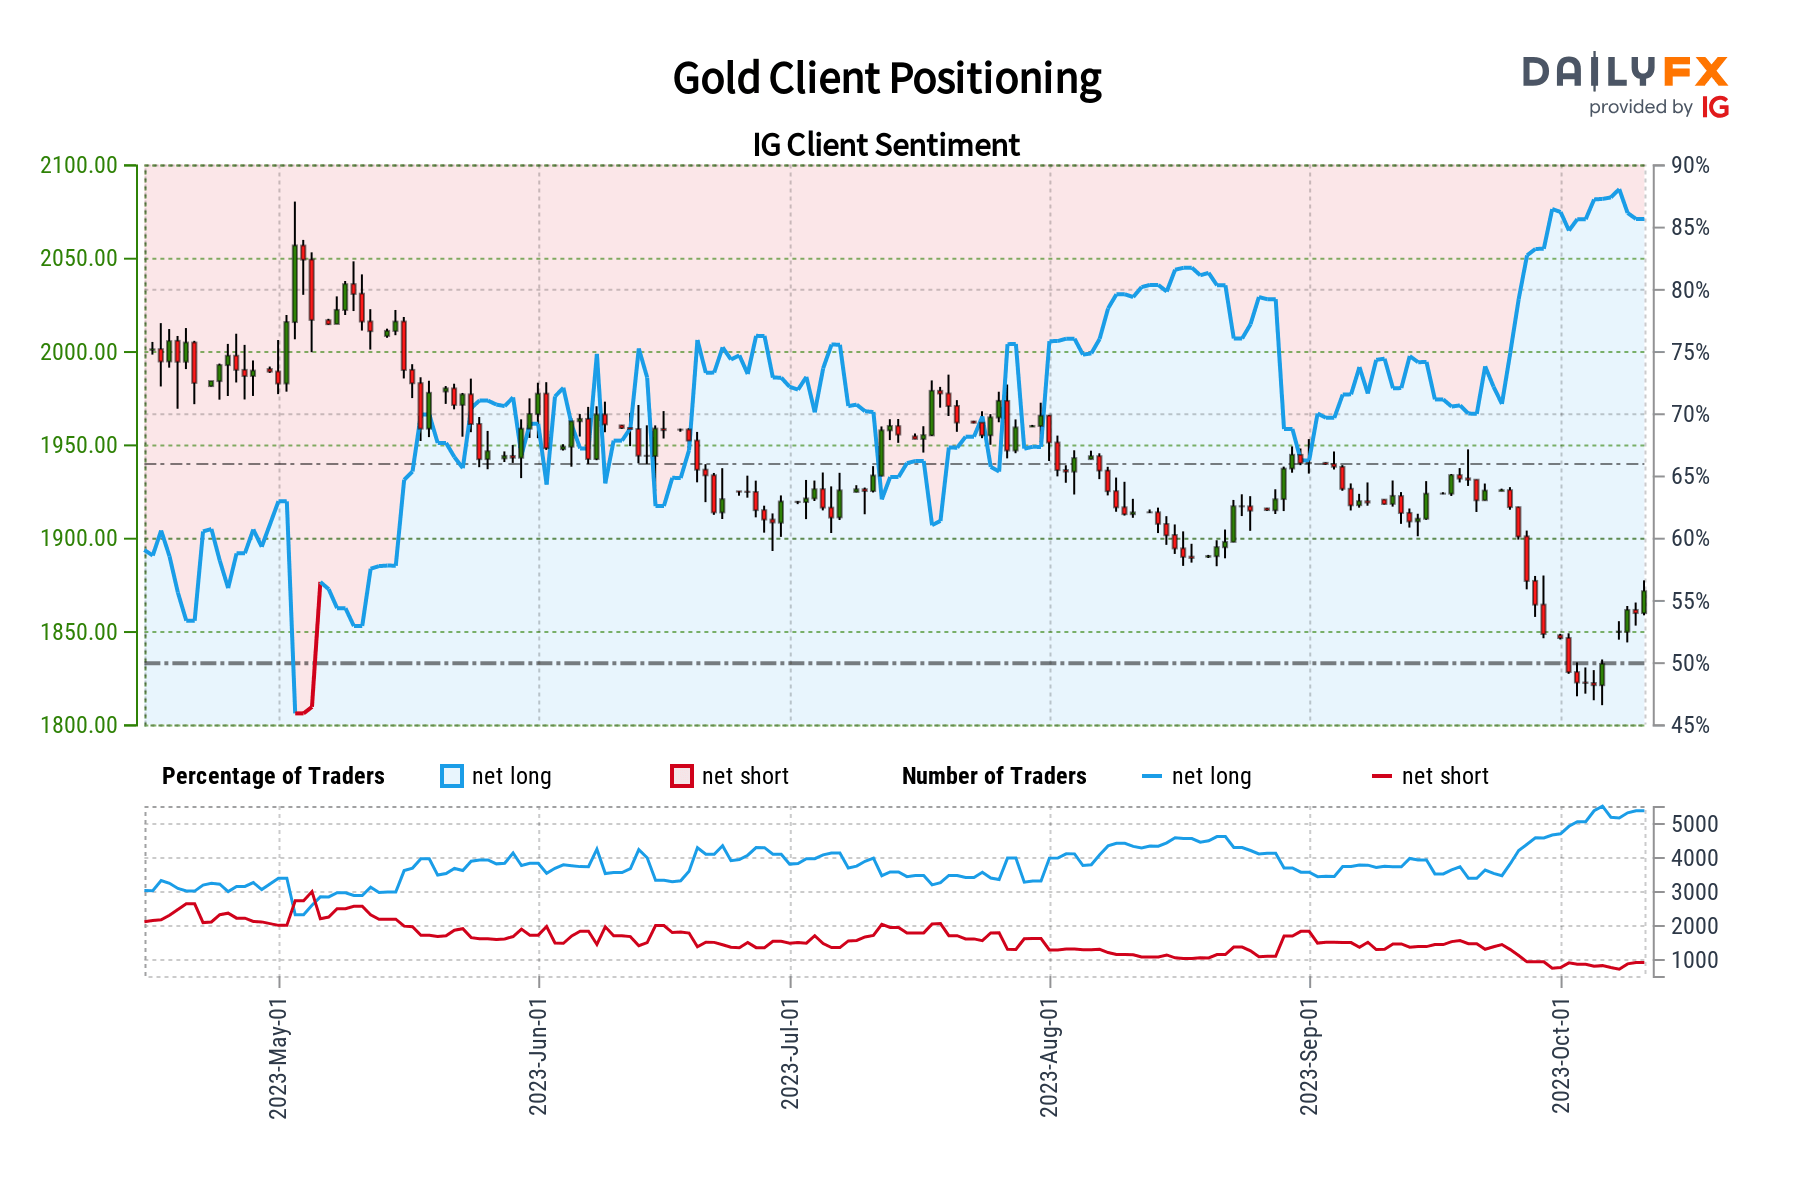
Gold prices are up over 2.3 percent this week so far, setting the stage for the best 5-day performance since the middle of March if gains are sustained. In response, retail traders have been becoming increasingly bearish as of late. This can be seen by taking a look at IG Client Sentiment (IGCS), which often functions as a contrarian indicator. With that in mind, will XAU/USD continue higher from here?
Gold Sentiment Outlook - Bullish
The IGCS gauge shows that about 83% of retail traders are net-long gold. Since the majority of them are biased to the upside, this continues to hint that prices may continue lower down the road. But, downside bets have increased by 18.59% and 26.67% compared to yesterday and last week, respectively. With that in mind, recent changes in exposure hint that prices may soon reverse higher.
| Change in | Longs | Shorts | OI |
| Daily | -3% | -2% | -2% |
| Weekly | -4% | 5% | -1% |
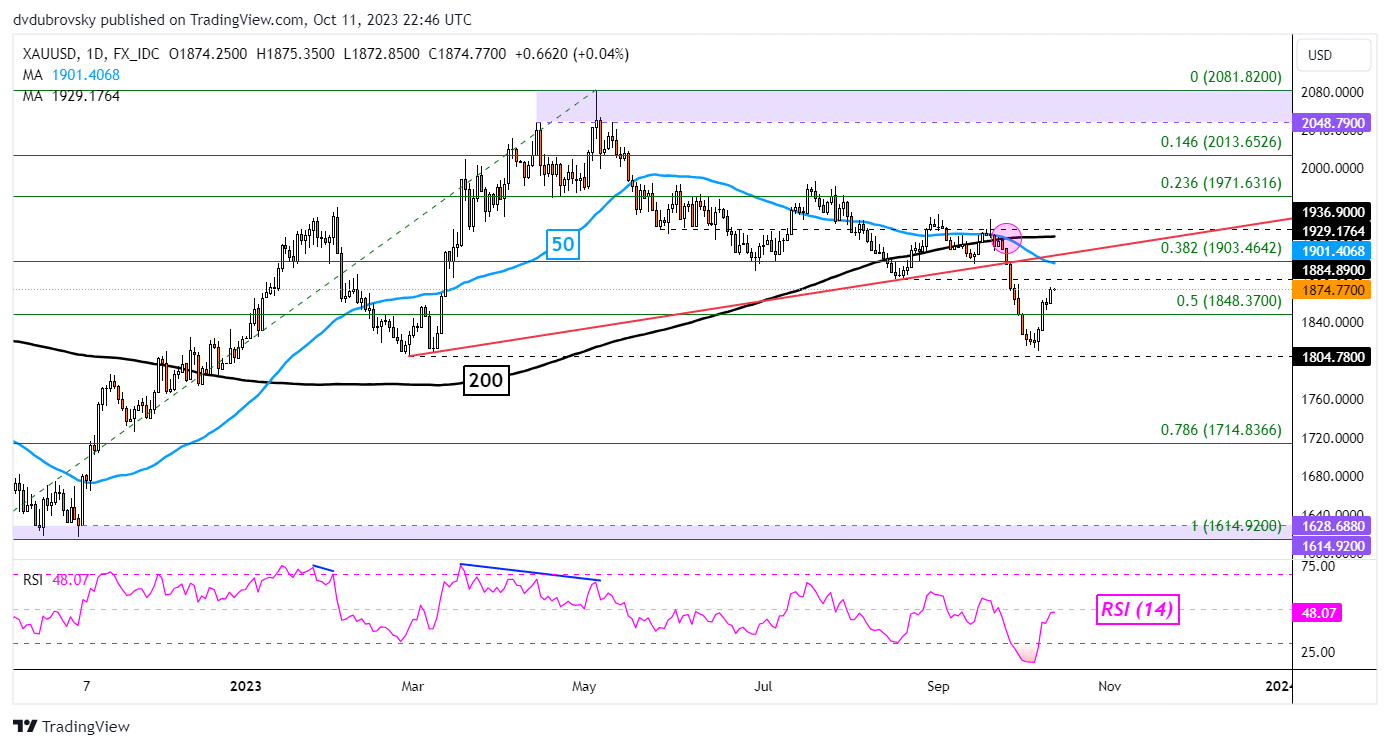
XAU/USD Daily Chart
On the daily chart below, gold has continued to bounce off the February low of 1804.78, subsequently confirming a break above the midpoint of the Fibonacci retracement level of 1848.37. That is placing the focus on the 1884.89 inflection point as immediate resistance with the 50-day moving average nearing just above that.
There has been a bearish Death Cross in play between the 50- and 200-day moving averages since September, which is underscoring a broader bearish technical bias. If the moving average holds, key support below is the February low. Taking it out will open the door to resuming the downtrend.

-- Written by Daniel Dubrovsky, Senior Strategist for DailyFX.com


