Gold, Retail Trader Positioning, Technical Analysis – IGCS Update
- Gold prices dipped as US longer-term Treasury yields rose
- Retail traders have responded by becoming more bullish
- This is a warning sign that further losses may be ahead

Over the past 48 hours, gold prices have weakened almost -1.7 percent. This follows a rise in longer-term US Treasury yields, especially looking at the 10- and 30-year bonds. XAU/USD often trades as the anti-fiat instrument, inversely tracking a combination of the US Dollar and Treasury yields.
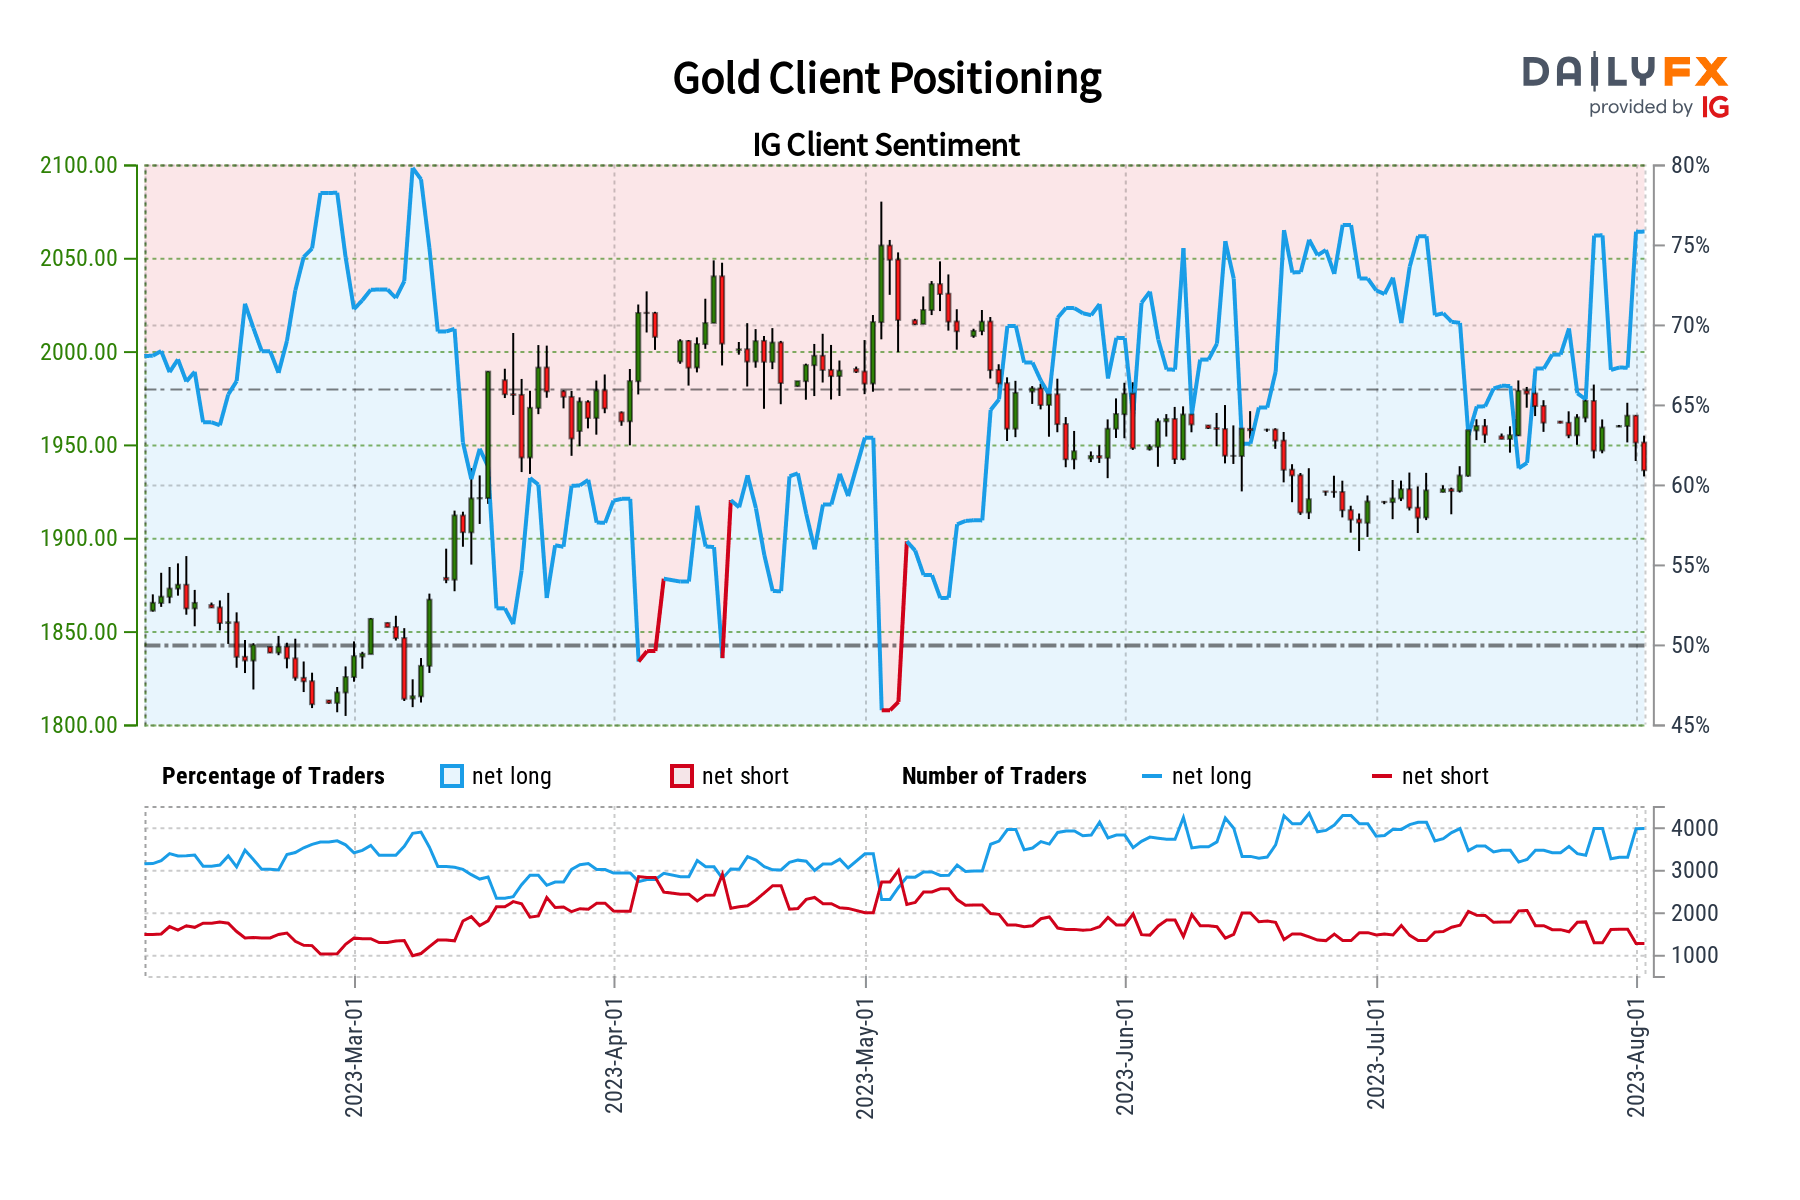
Now, retail traders are seemingly back to increasing their net-long exposure in gold. This can be seen by looking at IG Client Sentiment (IGCS). IGCS tends to function as a contrarian indicator. With that in mind, is this a signal that gold may continue lower from here?
Gold Sentiment Outlook - Bearish
The IGCS gauge shows that about 76% of retail traders are net-long gold. Since the majority are biased higher, this continues to hint that prices may continue falling down the road. This is as upside exposure increased by 2.96% and 23.76% compared to yesterday and last week, respectively. With that in mind, the combination of current positioning and recent changes in exposure offers a stronger bearish contrarian trading bias.
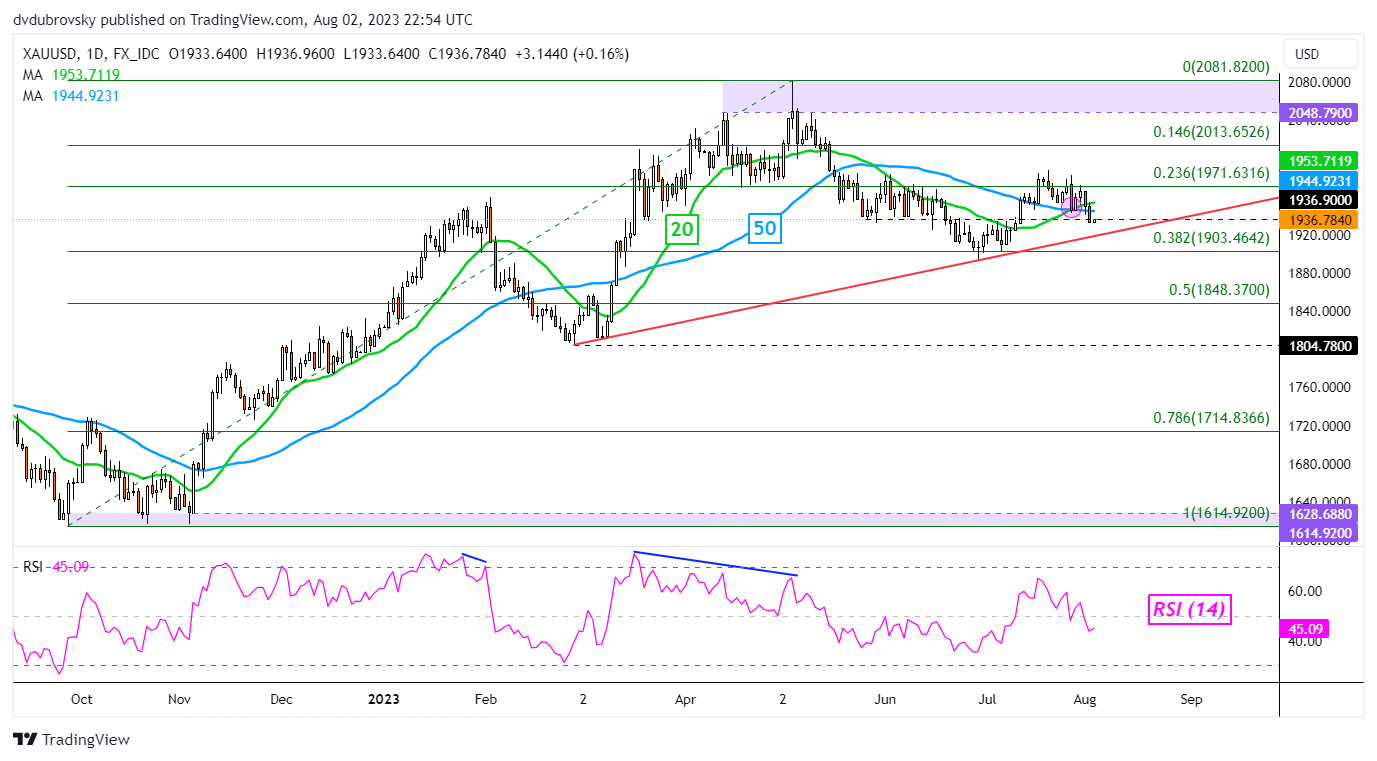
XAU/USD Daily Chart
A few days ago, a bullish Golden Cross formed between the 20- and 50-day Moving Averages (MA). Since then, cautious downside progress has been undermining the crossover. XAU/USD is now testing the 1936 inflection point from late May.
In the event of further losses, keep a close eye on the rising trendline from February. This is helping maintain the broader upside technical bias. Breaking under it would shift the outlook to increasingly bearish, placing the focus on the 38.2% Fibonacci retracement level at 1903. The latter held as support back in June. Clearing lower exposes the midpoint at 1848.
Otherwise, a turn higher and push through the 23.6% level at 1971 places the focus on highs from May.

-- Written by Daniel Dubrovsky, Senior Strategist for DailyFX.com