

Major Indices Talking Points:
- FTSE 100 continues its decline
- DAX falls through trendline support
- S&P 500 drops heavily from record high

FTSE 100 Continues its Decline
The FTSE 100 continued its short-term bearish run and on Thursday saw its biggest drop year-to-date amid weaker-than-expected flash PMI data for May, especially in the services sector. Further downside pressure is seen on Friday as UK retail sales fell by 2.7% YoY in April versus an expected -0.2% fall.
A potential downside target is the late April high at 8,200 while no rise above Thursday’s high at 8,385 is seen.
FTSE Daily Chart
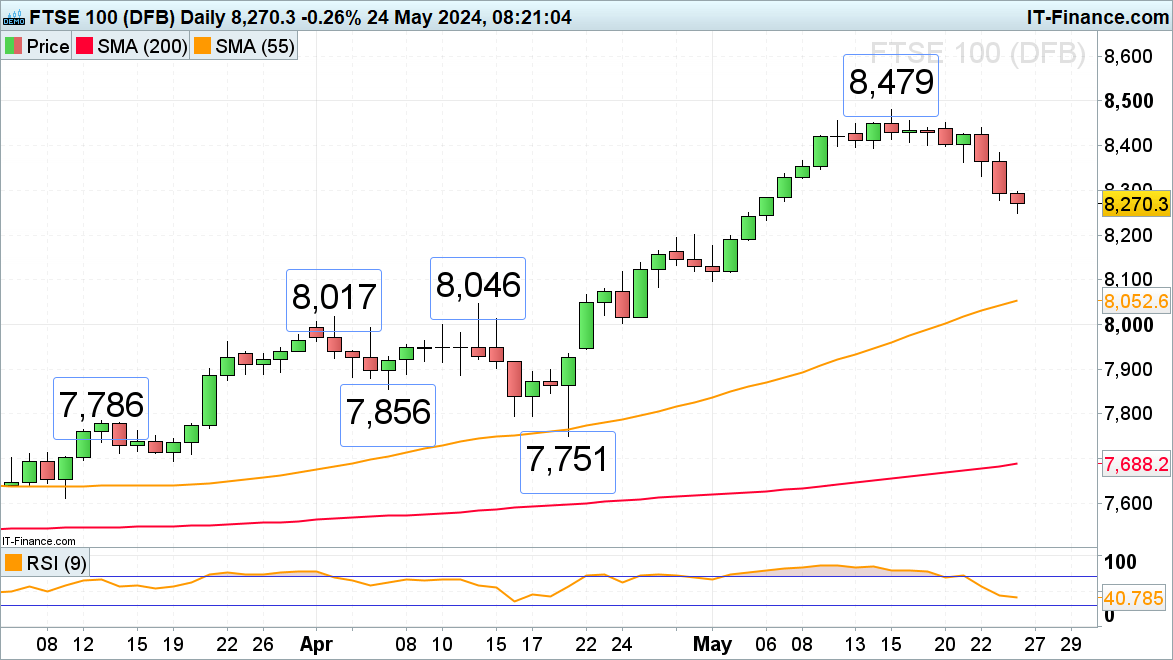
Source: IG, ProRealTime, prepared by Axel Rudolph
DAX 40 falls through uptrend line
The DAX 40 is on track for its third consecutive day of losses, having slid through its April-to-May uptrend line.
Minor support sits at the 4 April 18,429 high ahead of the 24 to 29 April highs at 18,240 to 18,238.
Resistance can be seen along the breached uptrend line at 18,666.
DAX Daily Chart
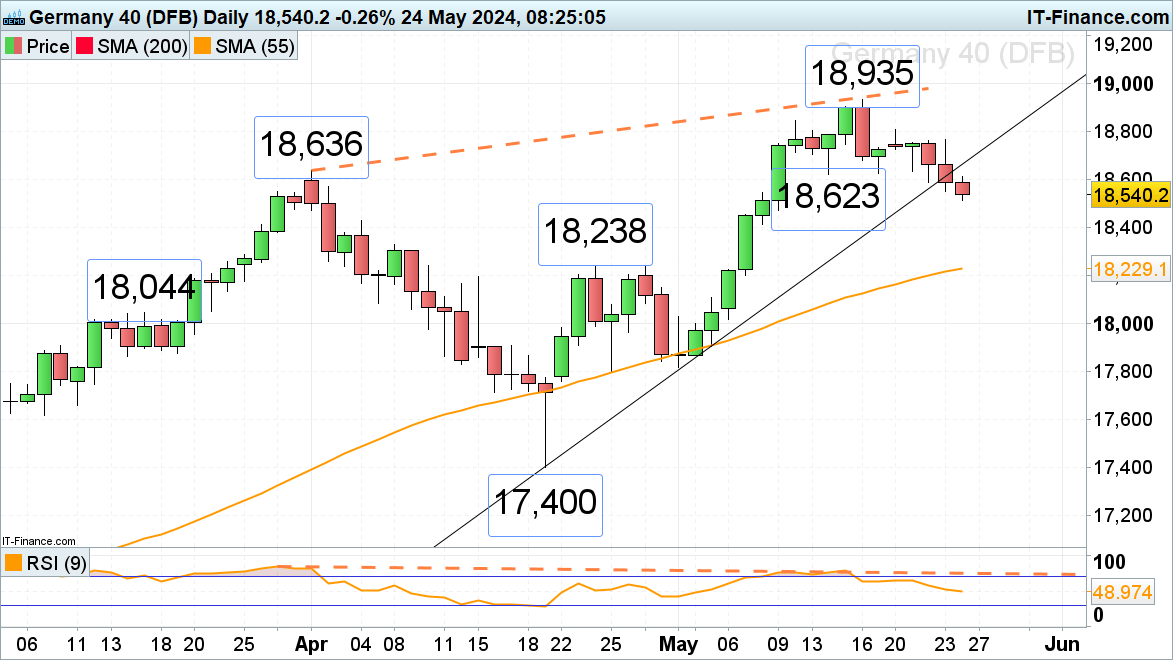
Source: IG, ProRealTime, prepared by Axel Rudolph
S&P 500 drops heavily from record high
The S&P 500 has swiftly come off Thursday’s record high at 5,343 and slid by over a percent as strong US flash PMI data increased expectations that interest rates will remain higher for longer, leading investors to shy away from risky assets.
A fall through Thursday’s low at 5,257 would put the 10 May high at 5,239 on the map, below which lies the mid-May low at 5,194. Were it to be fallen through as well, a medium-term top may be formed.
Minor resistance above Wednesday’s low at 5,286 is seen at last week’s 5,319 high.
S&P 500 Daily Chart
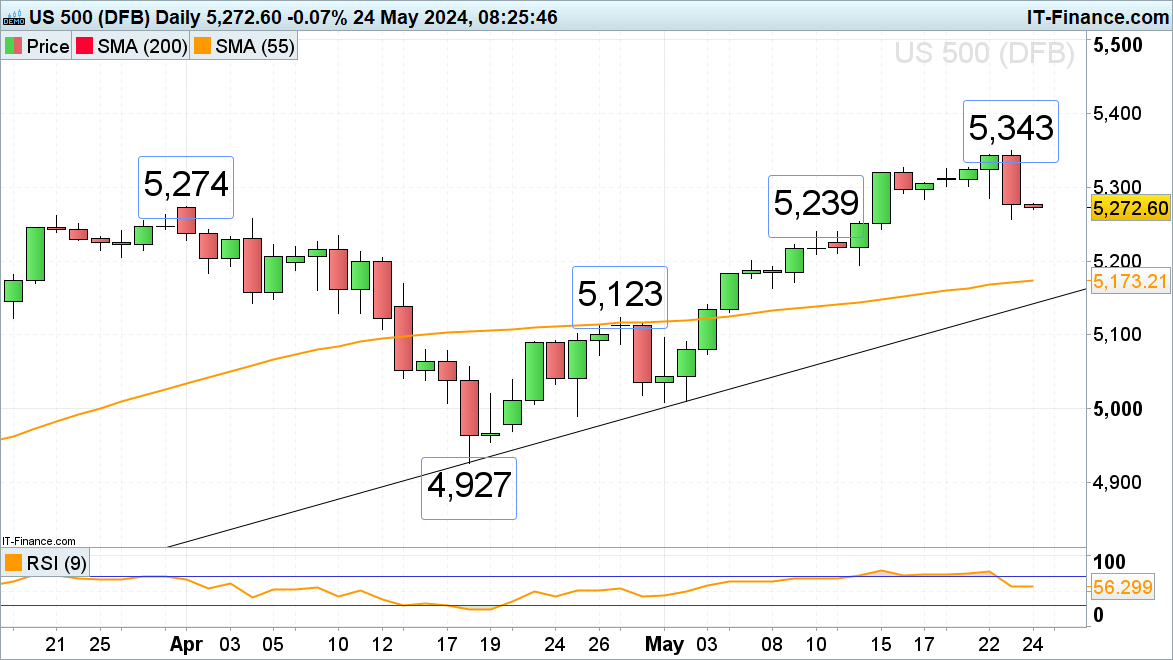
Source: IG, ProRealTime, prepared by Axel Rudolph
If you're puzzled by trading losses, why not take a step in the right direction? Download our guide, "Traits of Successful Traders," and gain valuable insights to steer clear of common pitfalls that can lead to costly errors.