


Euro, EUR/USD, US Dollar, EUR/JPY, Japanese Yen, EUR/GBP, British Pound, Trend, Range - Talking Points
- Euro appears to be struggling against the US Dollar with a trend unfolding
- EUR/JPY has steadied after a downside breakout move was rejected
- EUR/GBP continues to bounce around in the range for now. Will EUR/GBP break out?

EUR/USD TECHNICAL ANALYSIS
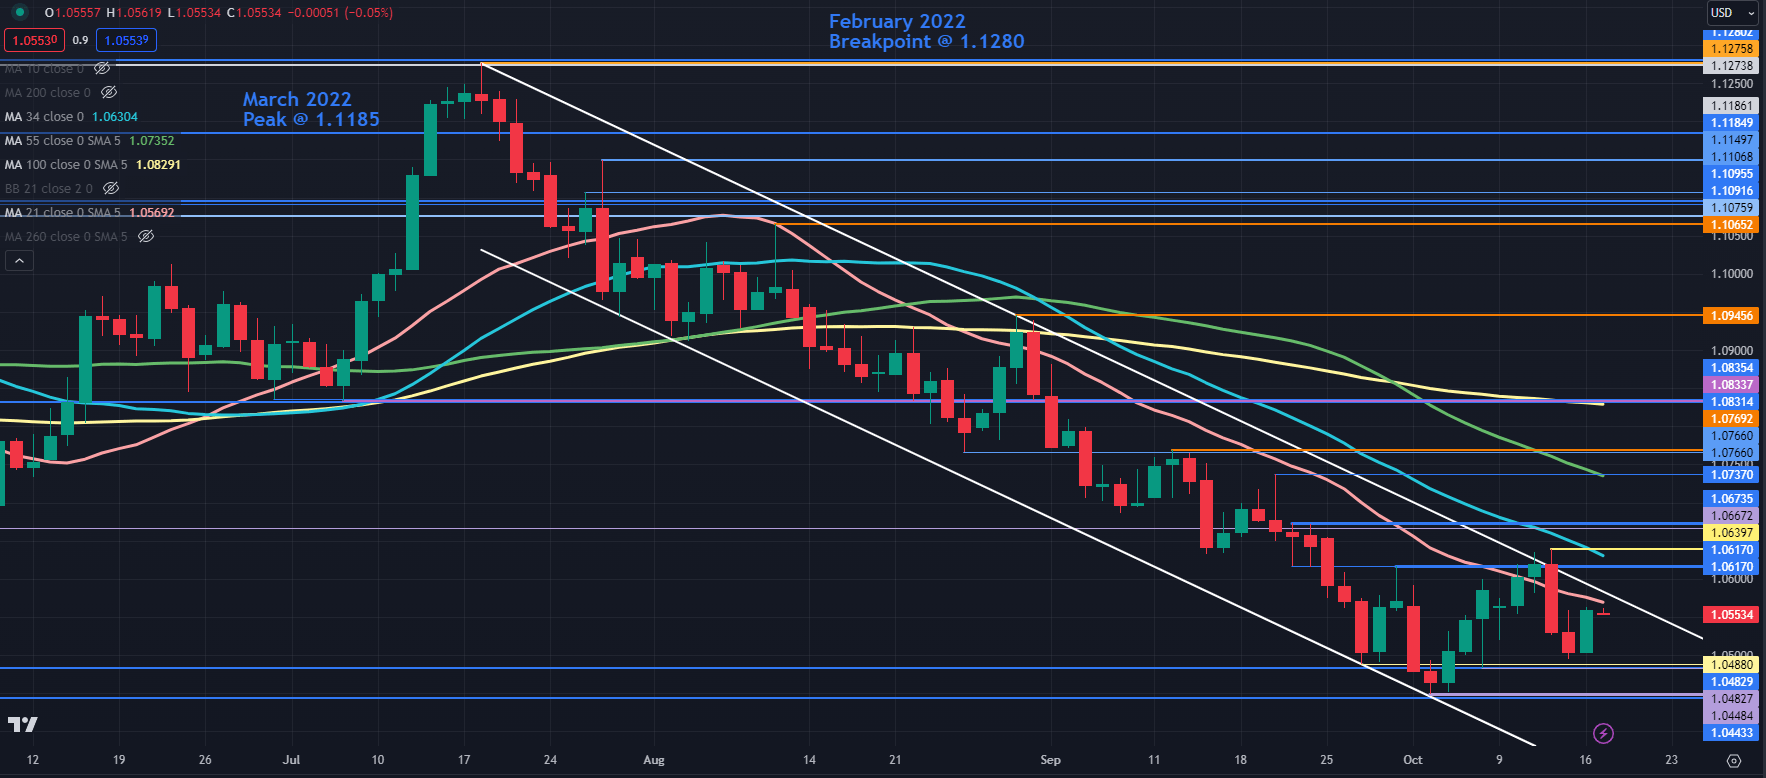
EUR/USD tried to break the topside of a descending trend channel last week but was unsuccessful and the channel remains in play for now.
That move posted a peak of 1.0640 but the daily close was below the descending trend line, potentially reaffirming that the trendline is intact.
A break above the trend line may see nearby resistance at the breakpoints and previous highs near 1.0620, 1.0640 and 1.0675.
Further up, resistance might be offered at a prior peak at 1.0737, which currently coincides with the 55-day simple moving average (SMA). Above there, another prior high and breakpoint near 1.0770 could offer resistance.
A bearish triple moving average (TMA) formation requires the price to be below the short-term SMA, the latter to be below the medium-term SMA and the medium-term SMA to be below the long-term SMA. All SMAs also need to have a negative gradient.
When looking at any combination of the 21-, 34-, 55- and 100-day SMAs, the criteria for a TMA have been met and might suggest that bearish momentum is evolving.
On the downside, support might lie near the breakpoints and lows of early 2023 that were tested at the start of this month with 1.0480 and 1.0440 as potential levels of note.
EUR/USD DAILY CHART
EUR/JPY TECHNICAL ANALYSIS
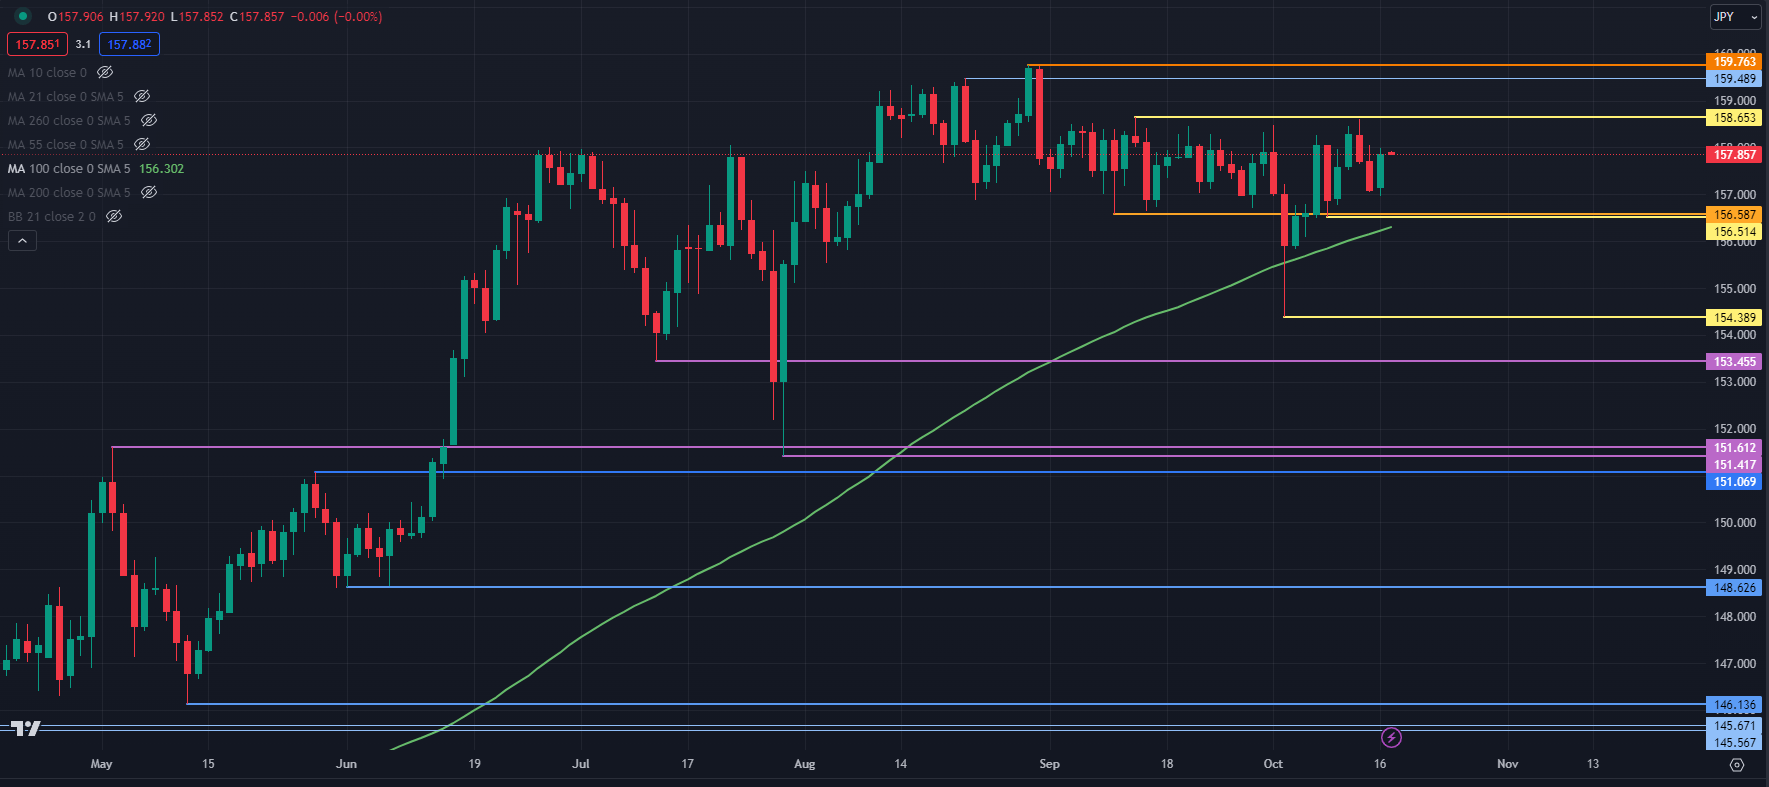
EUR/JPY appears to have settled back into its recent range after rejecting the move lower a fortnight ago when it traded down to a three-month low of 154.39.
That dip broke below the September low and the 100-day Simple Moving Average (SMA) before closing back above both of them in the proceeding sessions.
This may provide opportunities for A range trading strategy. To learn more about range trading, click on the banner below.

On the downside, support could be at the breakpoint and a recent low toward 156.50. On a sustained move lower, the levels to watch might be at the previous lows and breakpoints of 154.39, 153.45, 151.60, 151.40 and 151.07.
On the top side, the recent highs and breakpoint near 158.65, 159.50 and 159.75 may offer resistance.
EUR/JPY DAILY CHART
EUR/GBP TECHNICAL ANALYSIS
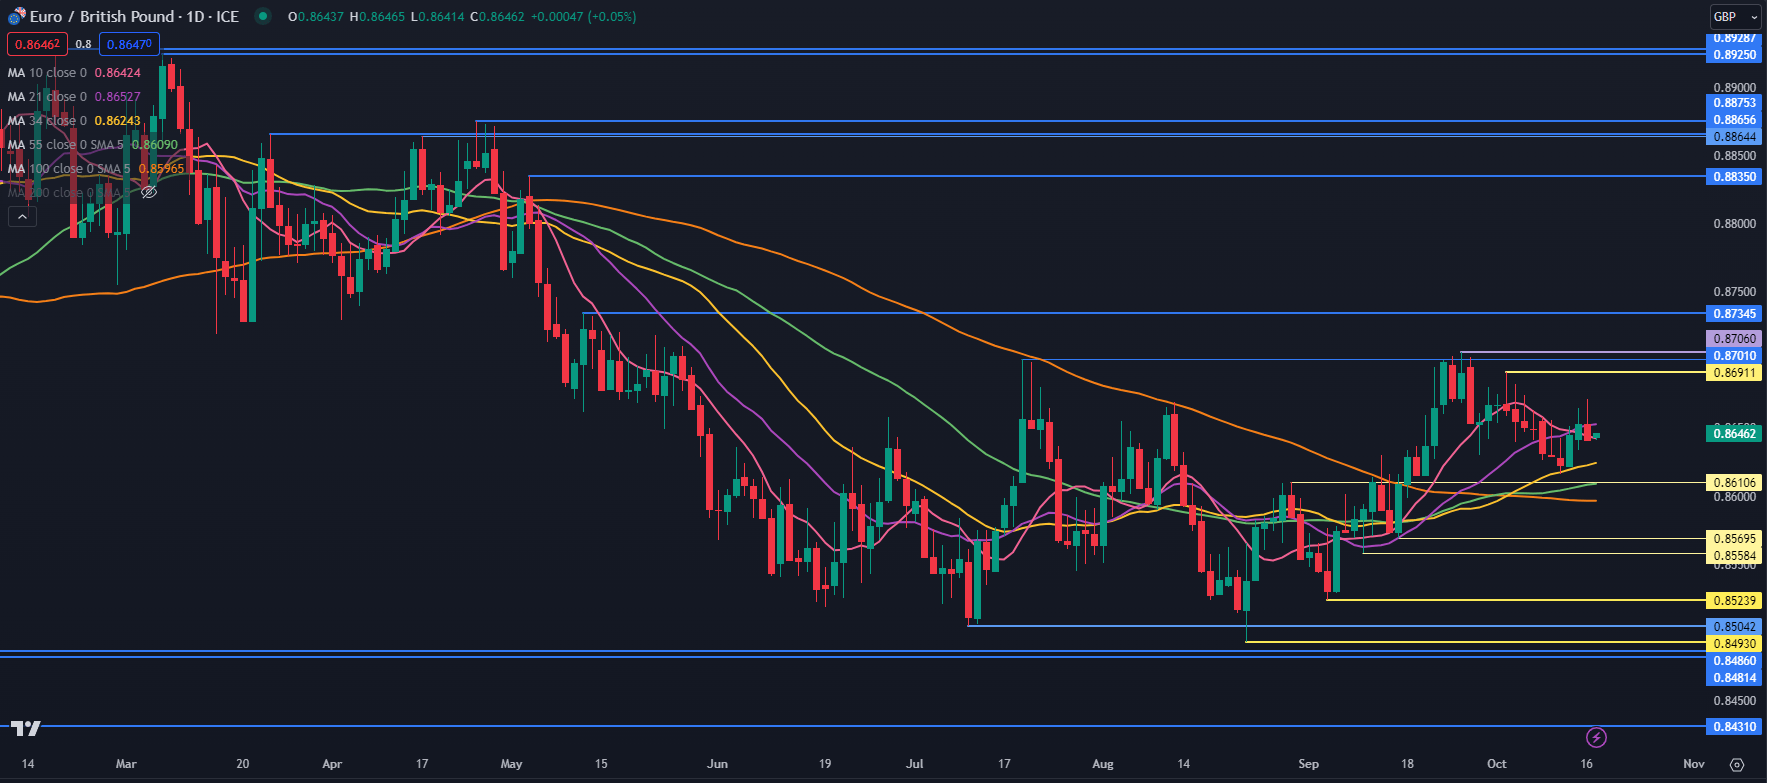
EUR/GBP has been trading between 0.8493 and 0.8706 for 5 months in what appears to be a range trading environment.
The 10-, 21-, 34-, 55- and 100-day SMAs are all grouped together between 0.8596 and 0.8653 potentially re-affirming the range trade environment for the time being.
However, if either side of the range is penetrated, a breakout trade opportunity may evolve. To learn more about breakout trading, click on the banner below.

Support might be at the breakpoints and recent lows of 0.8610, 0.8570, 0.8559, 0.8524, 0.8504 and 0.8493.
On the upside, resistance could be at the prior peaks of 0.8691, 0.8706 and 0.8735.
EUR/GBP DAILY CHART
--- Written by Daniel McCarthy, Strategist for DailyFX.com
To contact Daniel, use the comments section below or @DanMcCathyFX on Twitter


