


Euro, EUR/USD, RSI Divergence – Technical Update:
- Euro closed at its lowest in almost 3 months
- EUR/USD close to ending dominant uptrend
- EUR/GBP once again approaching support

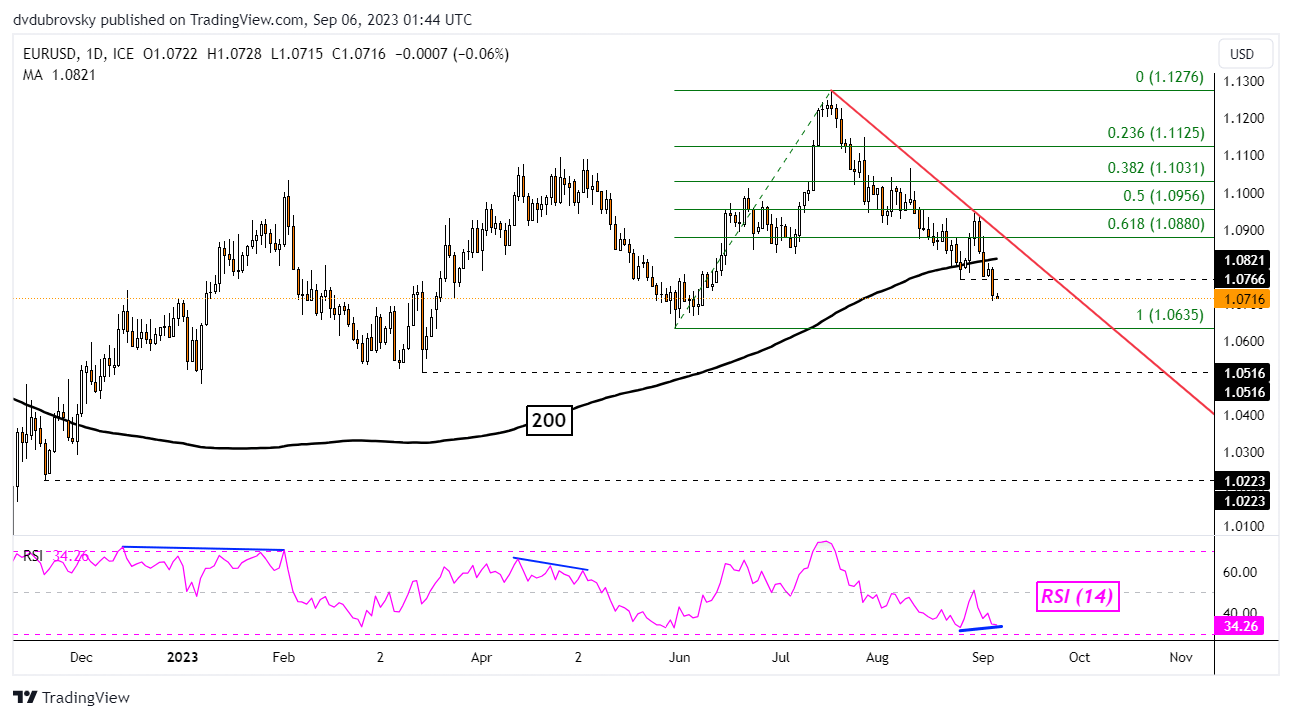
The Euro closed at its lowest against the US Dollar in almost 3 months, extending the downtrend since July. In fact, EUR/USD confirmed a breakout under the 200-day Moving Average. That is offering a stronger bearish technical conviction. Still, the dominant uptrend since late 2022 remains in play. Immediate support from here is 1.0635.
The latter is the May low. If the single currency breaks below this price and confirms the breakout, EUR/USD will effectively end the dominant uptrend since the end of last year, ending the strings of higher highs and higher lows. That would open the door to revisiting the March low of 1.0516. Otherwise, a turn higher from here places the focus on the falling trendline from July.

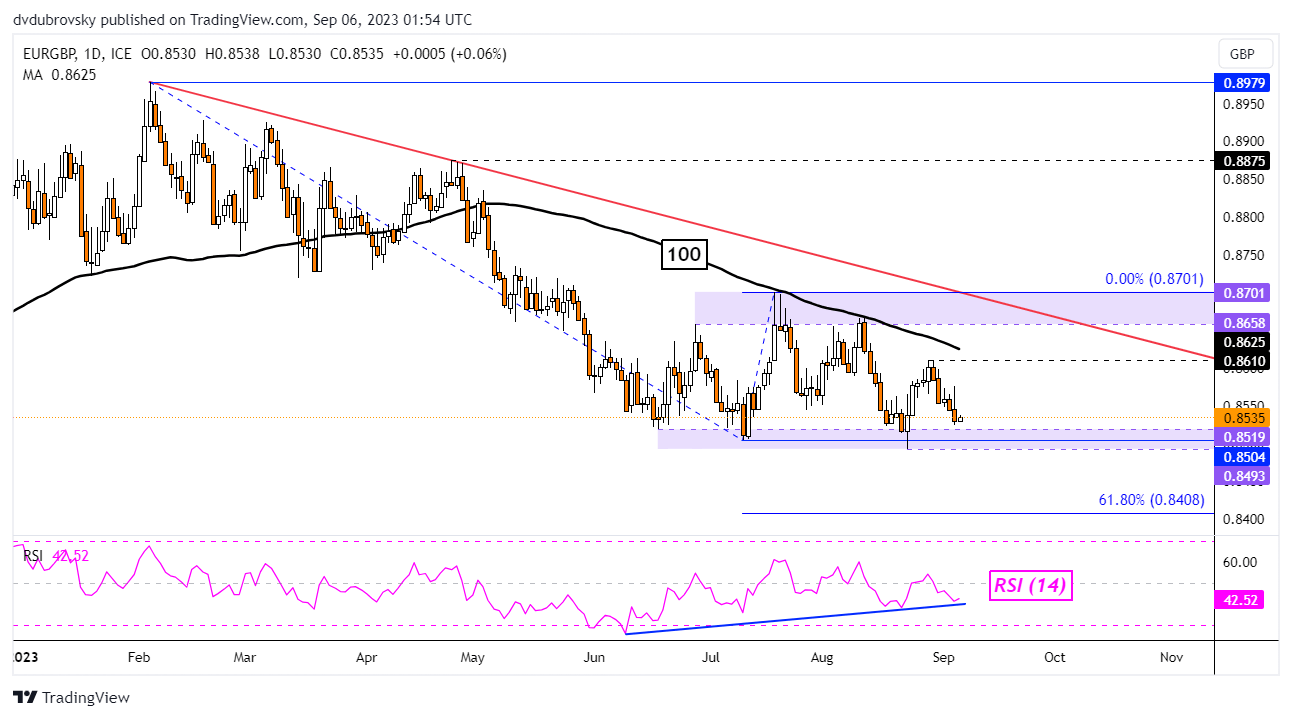
Meanwhile, the Euro is also struggling against the British Pound. After establishing new resistance at 0.861, EUR/GBP has been falling towards the key zone of support between 0.8493 and 0.8519. The latter has been holding since June, establishing a zone of consolidation with key resistance as the 0.8658 – 0.8701 range.
With positive RSI divergence brewing, fading downside momentum could open the door to a bounce off support. That would place the focus on the 100-day Moving Average, which can hold as resistance maintaining the broader downside focus since February. Otherwise, clearing through support places the focus on the 61.8% Fibonacci extension level of 0.8408.
| Change in | Longs | Shorts | OI |
| Daily | -4% | 1% | -1% |
| Weekly | -32% | 47% | -3% |
--- Written by Daniel Dubrovsky, Senior Strategist for DailyFX.com


