
Euro, EUR/USD, RSI Divergence, Rising Support – Technical Update:
- EUR/USD near-term downtrend pauses on rising support
- Positive RSI divergence on 4-hour shows fading momentum
- What are key levels to watch as the new week gets going?

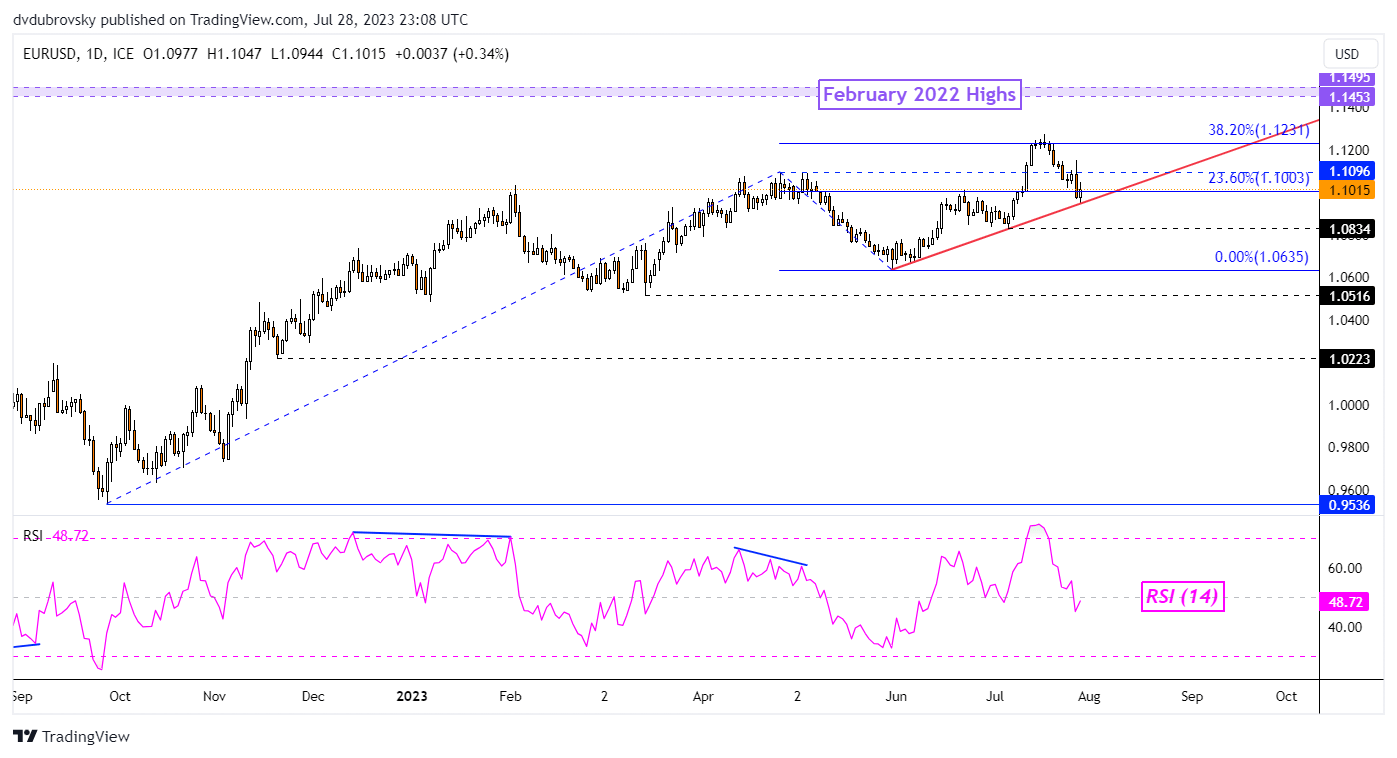
The Euro weakened against the US Dollar last week. That said, the broader upside technical focus for EUR/USD remains in play. This is because on the daily chart below, EUR/USD has fallen to the near-term rising support line from the end of June. The latter was held last week, maintaining the upside bias. A bounce off support places the focus on the 38.2% Fibonacci extension level at 1.1231.
Clearing above this point then exposes highs from February 2022, making for a zone of resistance between 1.1453 and 1.1495. In the event of a turn lower, the next key level of support seems to be 1.0834, which is the July 6th low. Beyond that sits the April low at 1.0635. Let us zoom in on the 4-hour chart to take a closer look at where near-term price action may go.
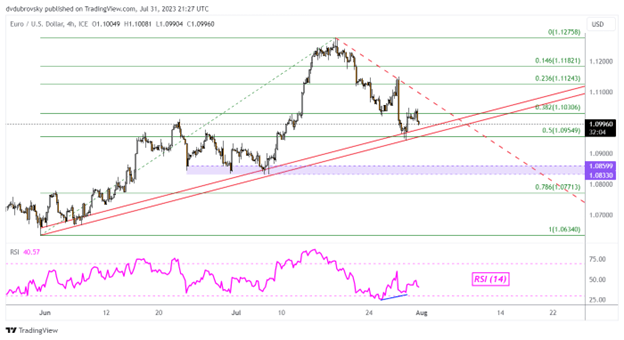
On the 4-hour chart below, we can observe that right before the Euro bounced off rising support from June, positive RSI divergence was brewing. This is a sign of fading downside momentum, which can at times precede a turn higher. In the event of near-term upside progress from here, that would place the focus on a potential falling trendline from July’s high.
Clearing above that exposes the minor 14.6% Fibonacci retracement level at 1.1182 before placing the focus on 1.12758. Just below rising support is the midpoint at 1.0954. Clearing under this price exposes the 1.0833 – 1.0859 support zone. This is made up of lows from early July. Further downside progress from there could open the door to a drop to the May low of 1.0635.

--- Written by Daniel Dubrovsky, Senior Strategist for DailyFX.com