Dow Jones, S&P 500, Hang Seng Analysis and Charts
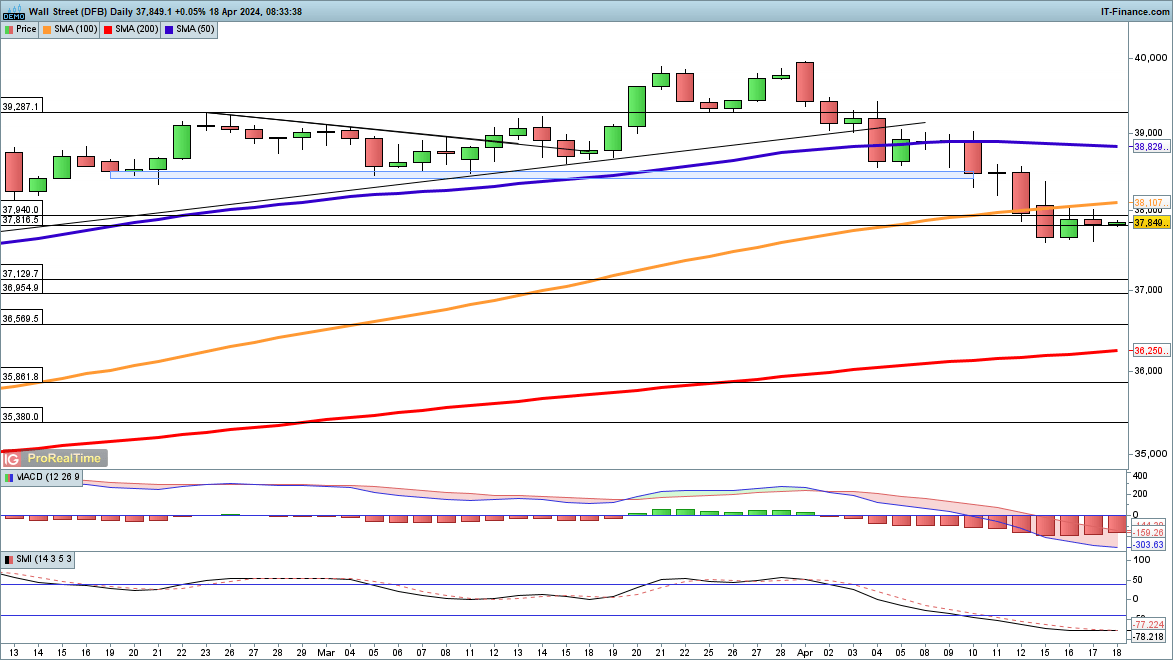
Dow losses halted for now
The run of losses for the index appears to have slowed, with the price holding above the lows seen on Monday around 37,600. In the short term, a close above 38,000 and then above the 100-day simple moving average (SMA), currently 38,107, could suggest that a tradeable low has formed. A new leg higher would target 39,000, and then perhaps on to 40,000.
A close below 37,500 signals more downside to come.
DowJones Daily Chart
You can download our Q2 Equity Forecasts for free using the link below

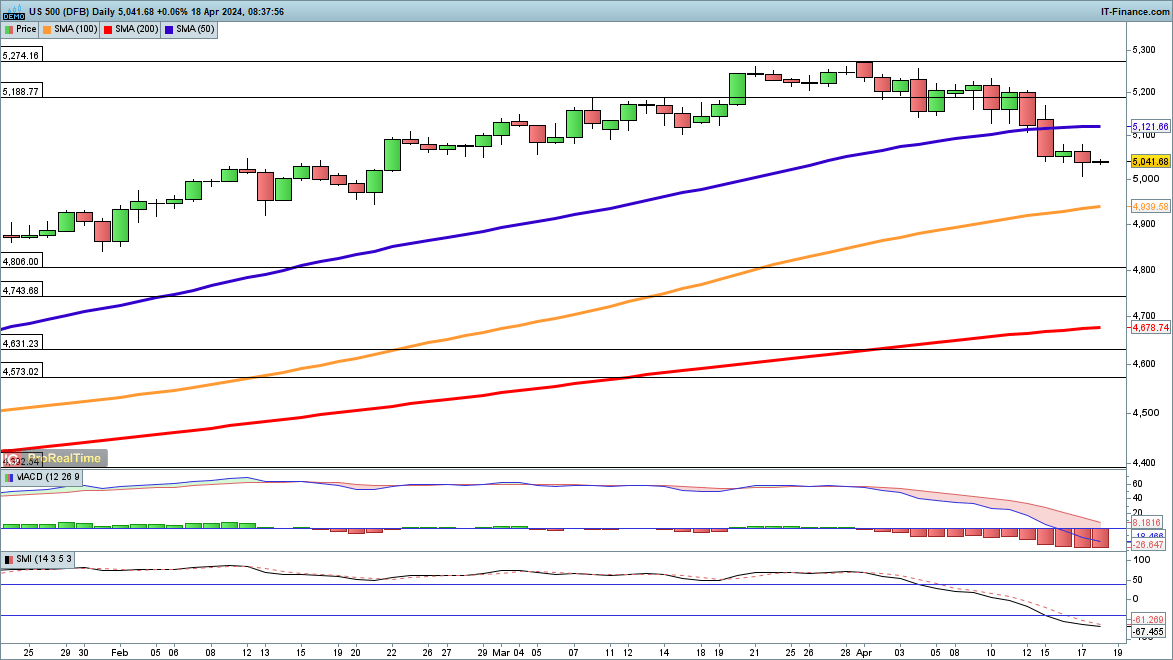
S&P 500 edges higher
The index touched a two-month low yesterday, though it has yet to close below 5000. A close back above 5100 and the 50-day SMA at 5121 would signal that a higher low is in place for the time being, and could signal that a new leg higher is underway.
By contrast, if sellers can drive the price below 5000 then we may see a test of the 100-day SMA, with the late 2021 high at 4806 the next big level to watch.
S&P 500 Daily Chart
| Change in | Longs | Shorts | OI |
| Daily | 10% | -9% | -1% |
| Weekly | -4% | -3% | -3% |
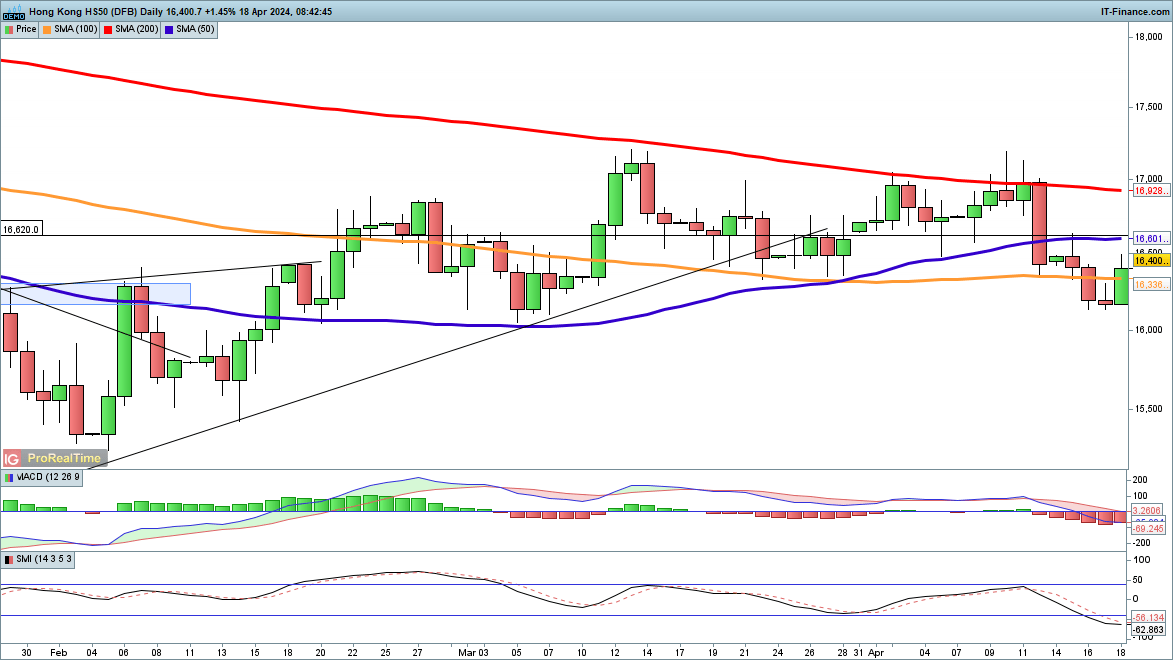
Hang Seng rallies
Recent weakness knocked the index to a six-week low, but a big up day overnight suggests a low might be in. Further gains above the 16,600 level and the 50-day SMA would help support a bullish view, and pen the way to the 17,000 highs from earlier in the month.
A breakout above 17,000 would help to suggest that a longer-term move has begun.
HangSeng Daily Chart