


Dow Jones, S&P 500, Retail Trader Positioning, Technical Analysis – IGCS Equities Update
- Dow Jones, S&P 500 have been weakening of late
- Retail traders still mostly short, but upside bets rise
- This could leave Wall Street further vulnerable ahead

The Dow Jones and S&P 500 have been aiming cautiously lower in recent days. In response, retail traders have started to increase their upside exposure. This can be seen by looking at IG Client Sentiment (IGCS). IGCS tends to function as a contrarian indicator. With that in mind, are recent changes in Wall Street positioning hinting that further losses might be in store for equities?
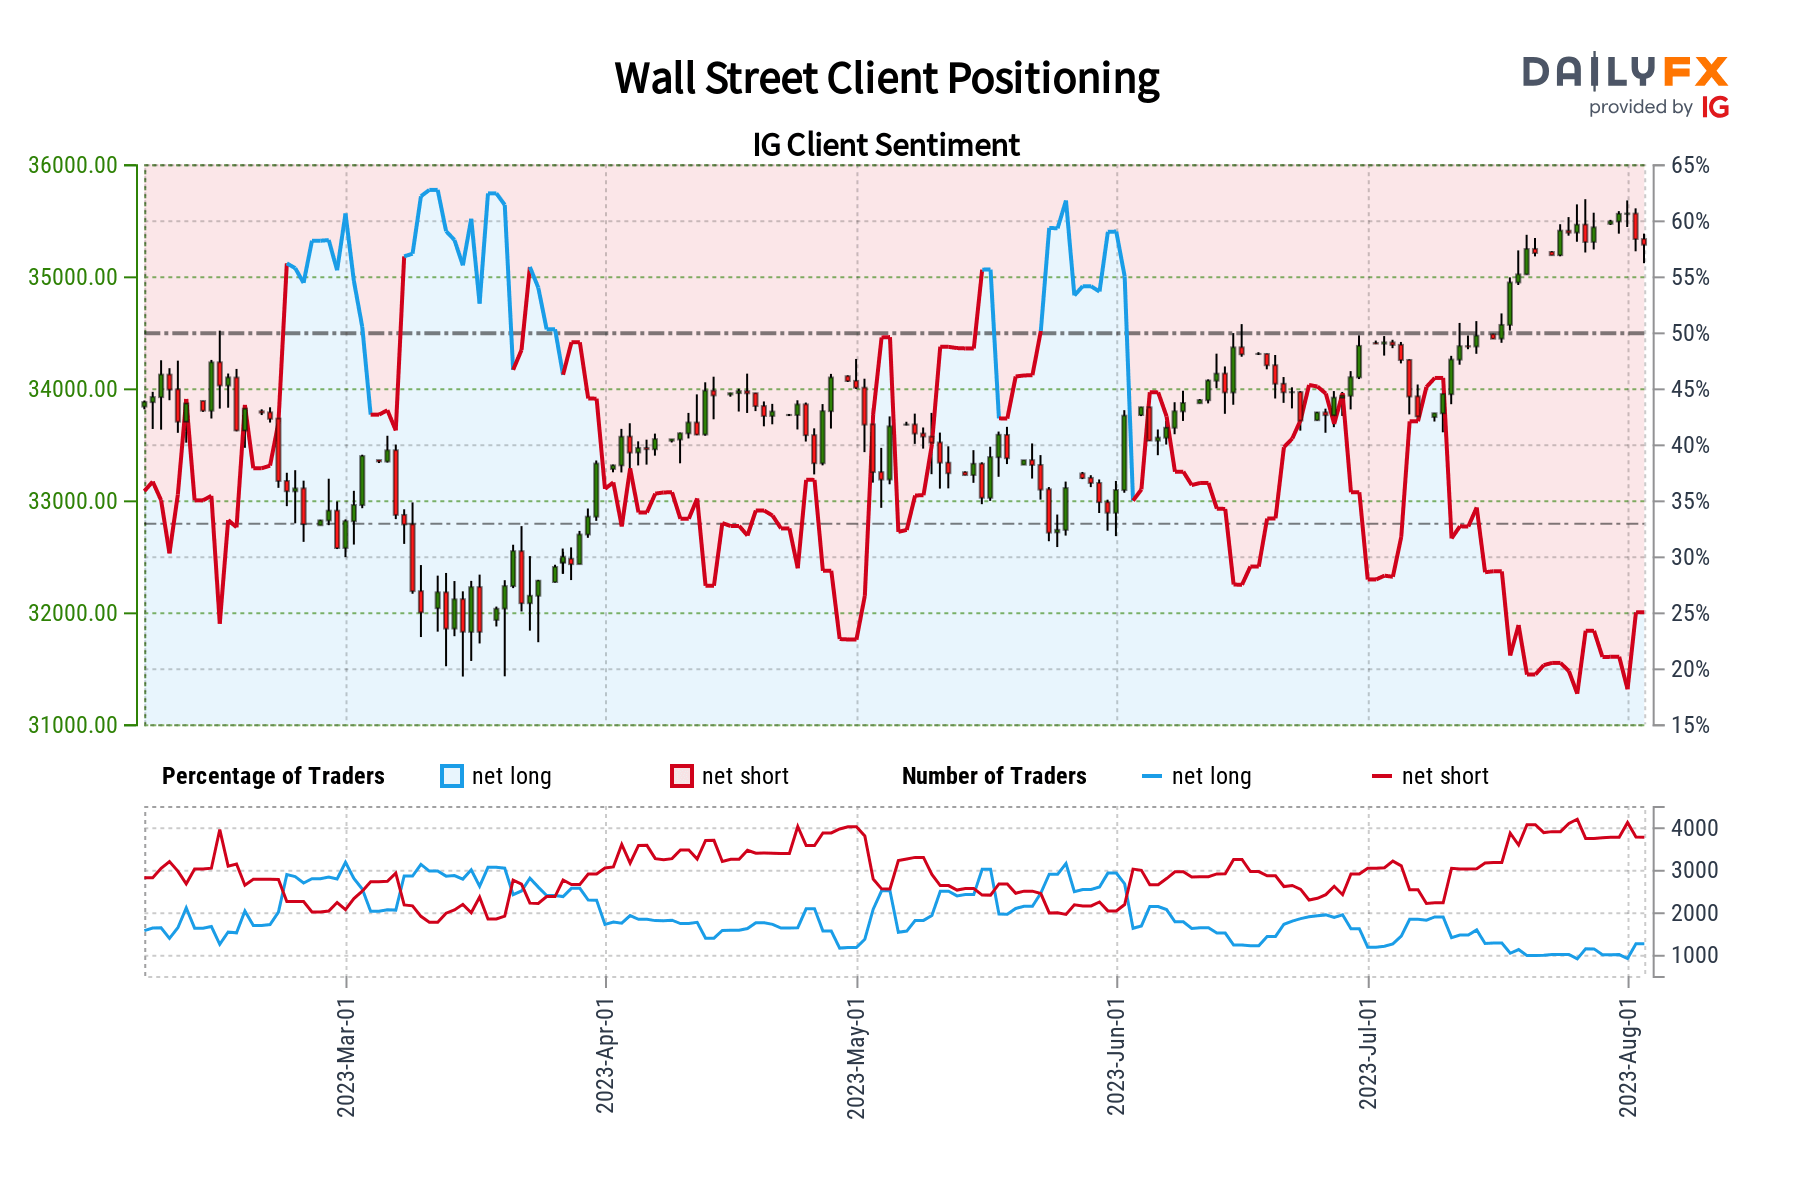
Dow Jones Sentiment Outlook - Bearish
According to IGCS, only about 27% of retail traders are net-long the Dow Jones. Since the majority of them are biased lower, this still hints that prices may continue climbing down the road. However, upside exposure has increased by 7.14% and 8.65% compared to yesterday and last week, respectively. With that in mind, recent changes in sentiment warn that the Dow Jones might soon reverse lower.
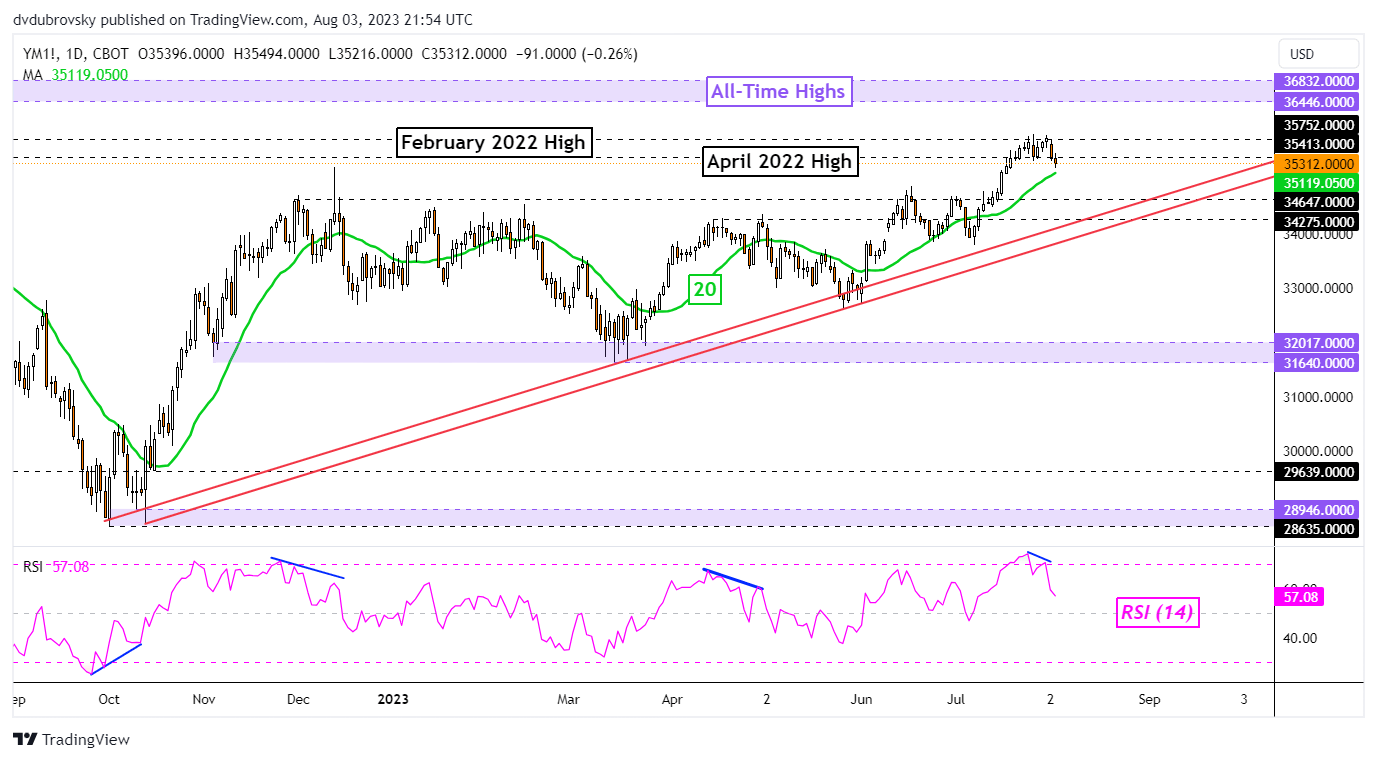
Dow Jones Technical Analysis
On the daily chart, the Dow Jones was unable to clear the February 2022 high of 25752 and it now seems like the next leg might be a turn lower. This is further compounded by negative RSI divergence, showing fading upside momentum. Immediate support is the 20-day Moving Average (MA), clearing lower exposes rising support from October.
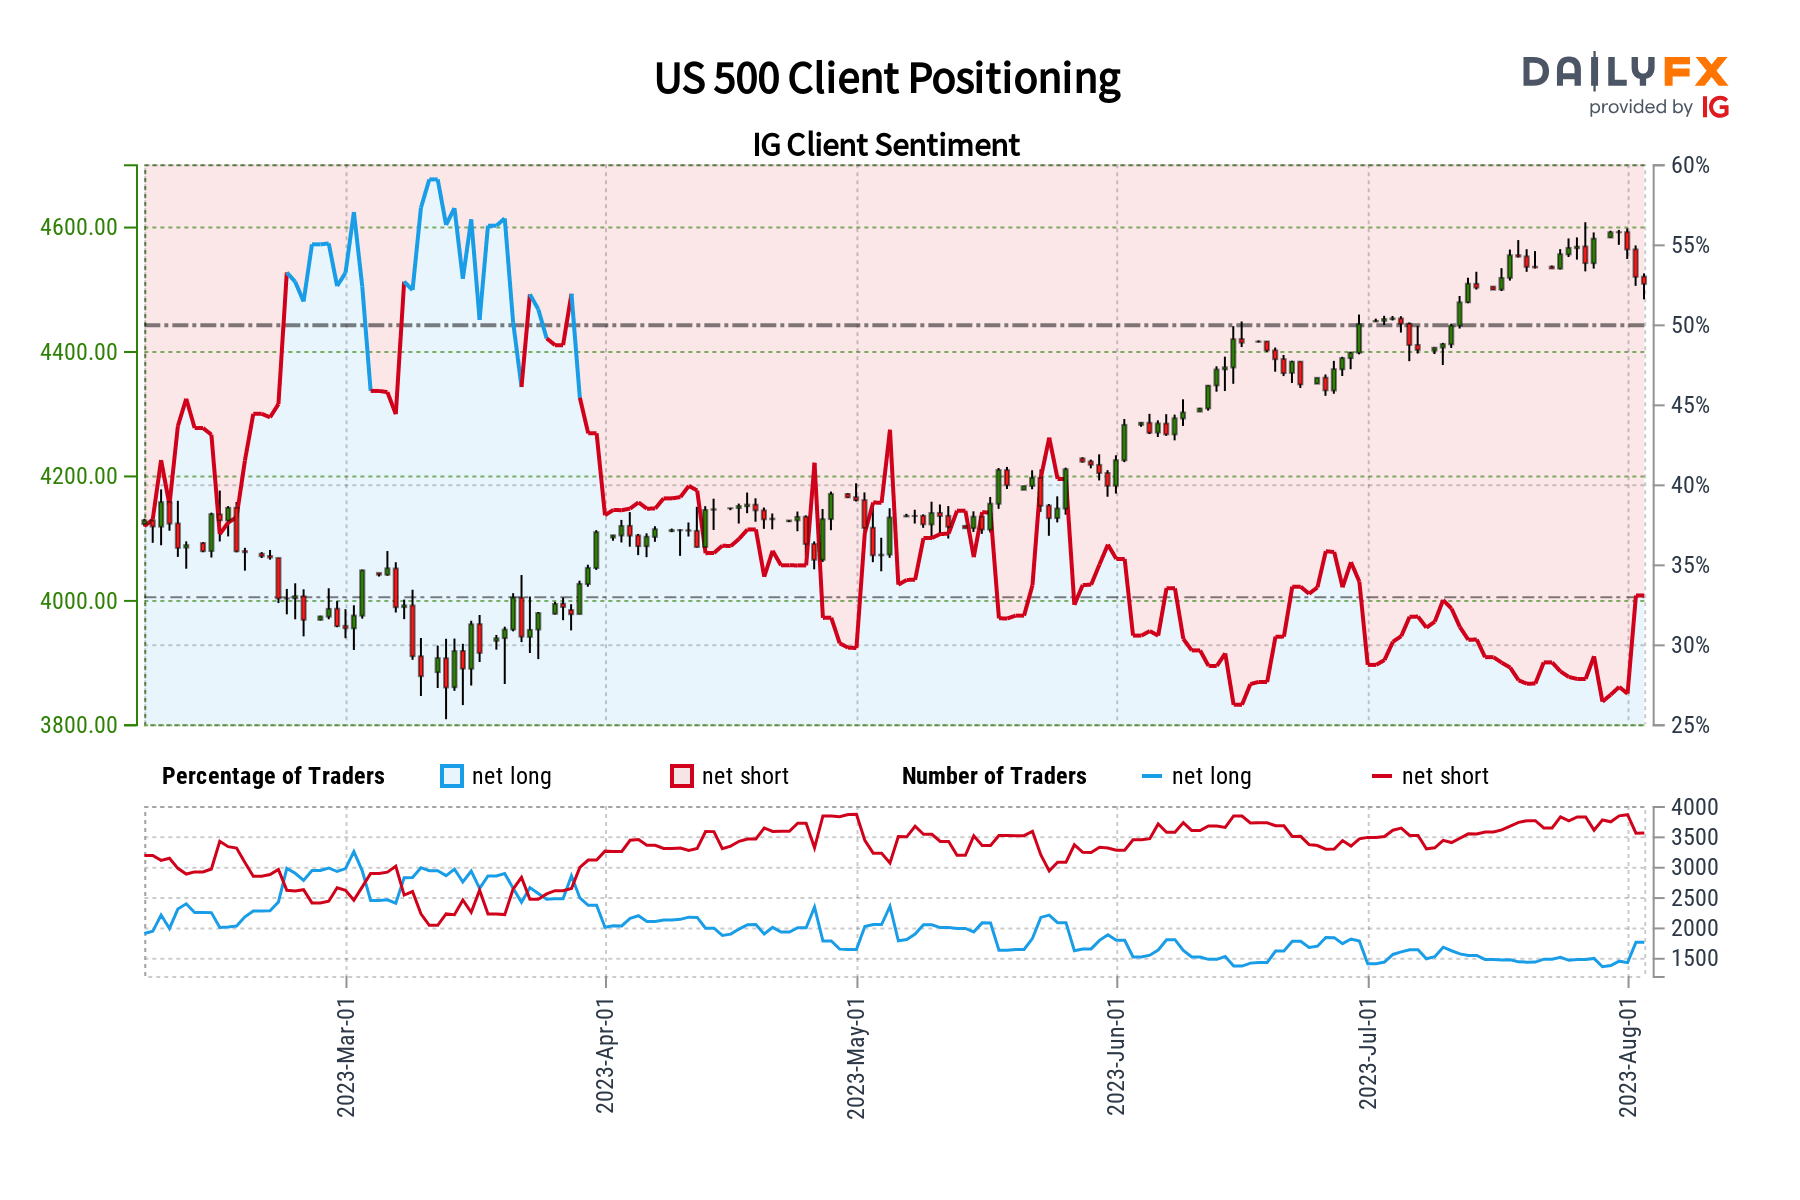
S&P 500 Sentiment Outlook - Bearish
According to IGCS, about 36% of retail traders are net-long the S&P 500. Since most of them are biased to the downside, this still suggests that prices may continue rising down the road. But, upside exposure has increased by 9.42% and 23.19% compared to yesterday and last week, respectively. With that in mind, recent changes in positioning warn that the S&P 500 may soon reverse lower despite overall exposure.

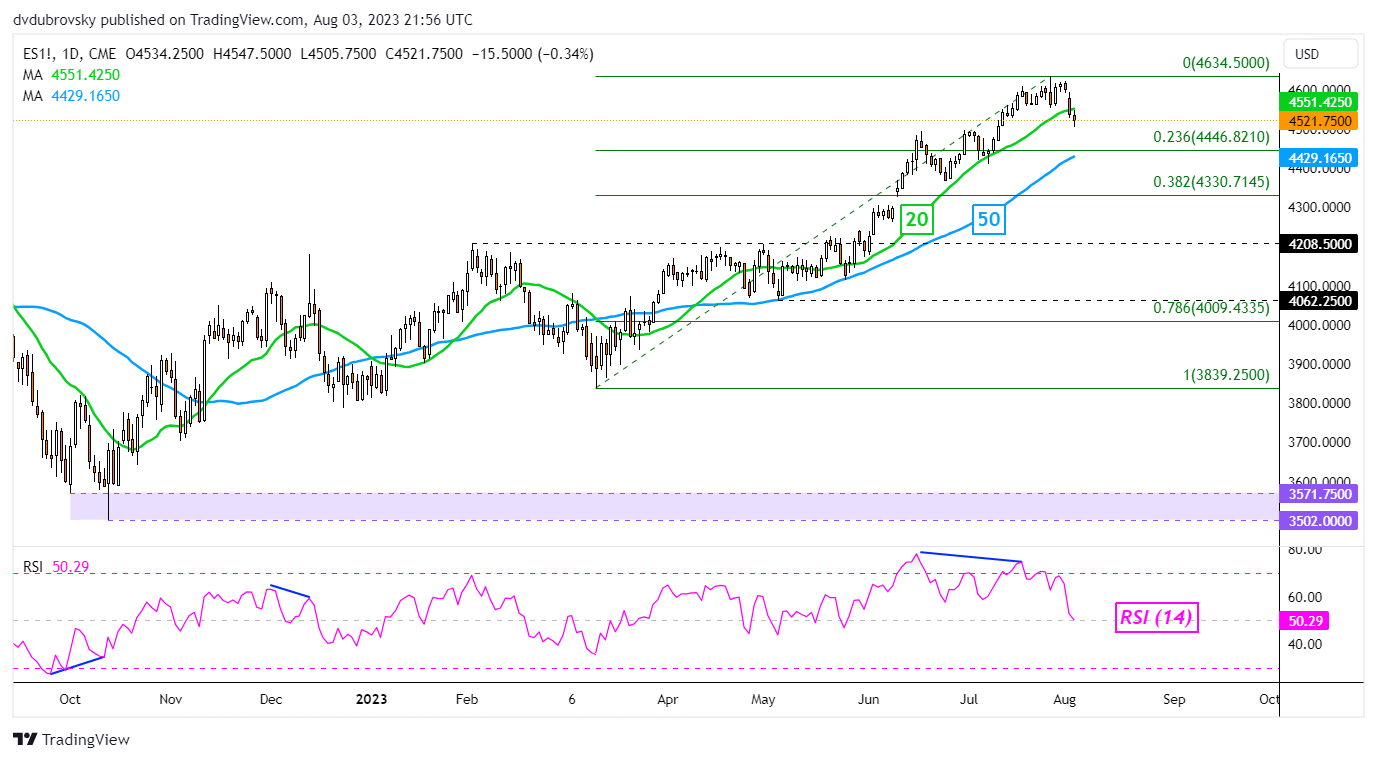
S&P 500 Technical Analysis
The S&P 500 has fallen for three consecutive days, weakening about 1.5 percent. That marks the worst 3-day period since early March. Prices also broke under and confirmed a push through the 20-day Moving Average. That has exposed immediate support at 4446 which is the 23.6% Fibonacci retracement level and the 50-day MA. Clearing under the latter opens the door to a stronger bearish technical bias.
--- Written by Daniel Dubrovsky, Senior Strategist for DailyFX.com


