


Crude Oil, WTI, Retail Trader Positioning, Technical Analysis – IGCS Commodities Update
- Crude oil prices fell the most over 2 days since early June
- Retail traders are increasingly building upside exposure
- This is an early warning sign that WTI may continue lower

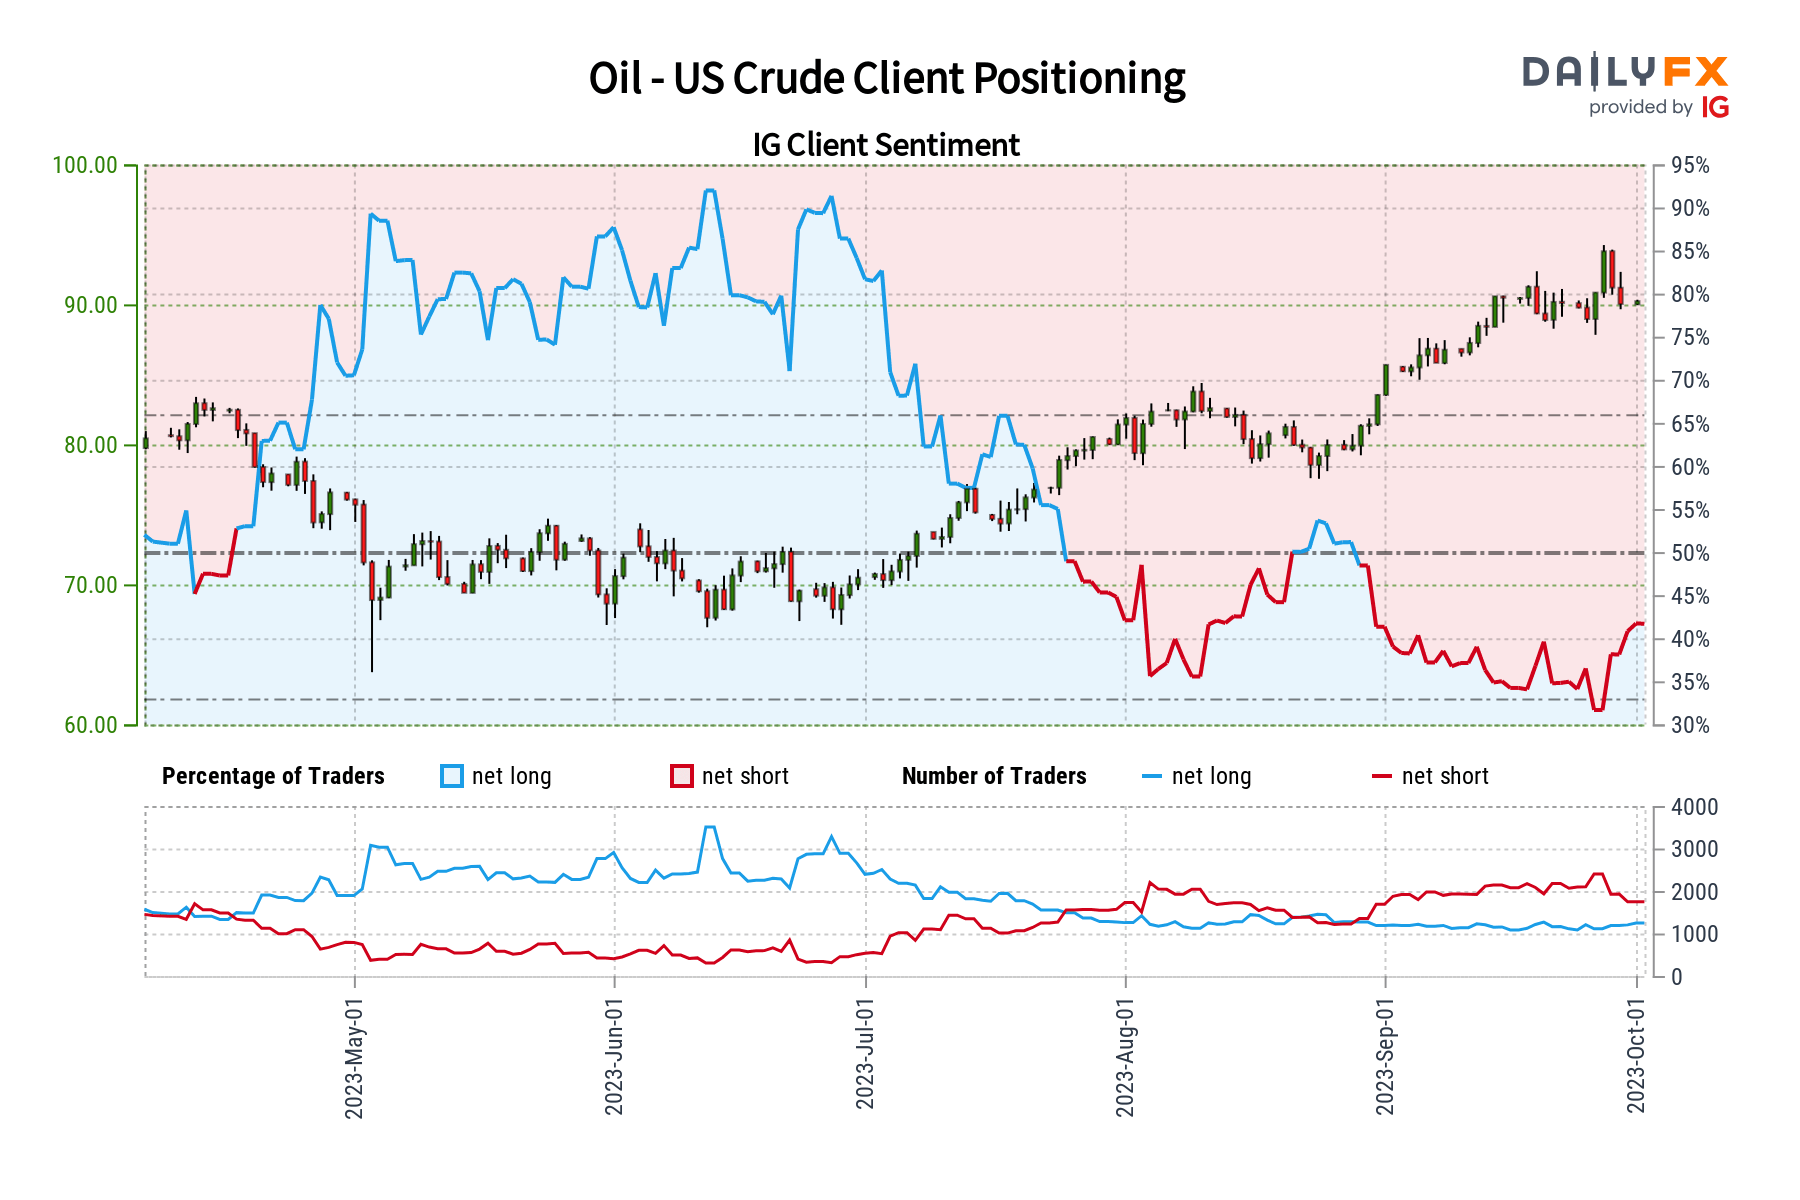
Over the past 2 days, crude oil prices have fallen more than -3.4 percent. This marked the worst 2-day performance since early June. In response, retail traders have begun increasing upside exposure. This can be seen by taking a look at IG Client Sentiment (IGCS), which often works as a contrarian indicator. With that in mind, could further pain be in store for oil next?
Crude Oil Sentiment Outlook - Bearish
According to IGCS, only about 45% of retail traders are net-long crude oil. Since most are still biased to the downside, this continues to suggest price may rise down the road. That said, upside exposure has increased by 8.8% and 11.11% compared to yesterday and last week, respectively. With that in mind, recent changes in bets warn that the current price trend may soon reverse lower.
| Change in | Longs | Shorts | OI |
| Daily | 4% | -11% | 1% |
| Weekly | 37% | -33% | 14% |
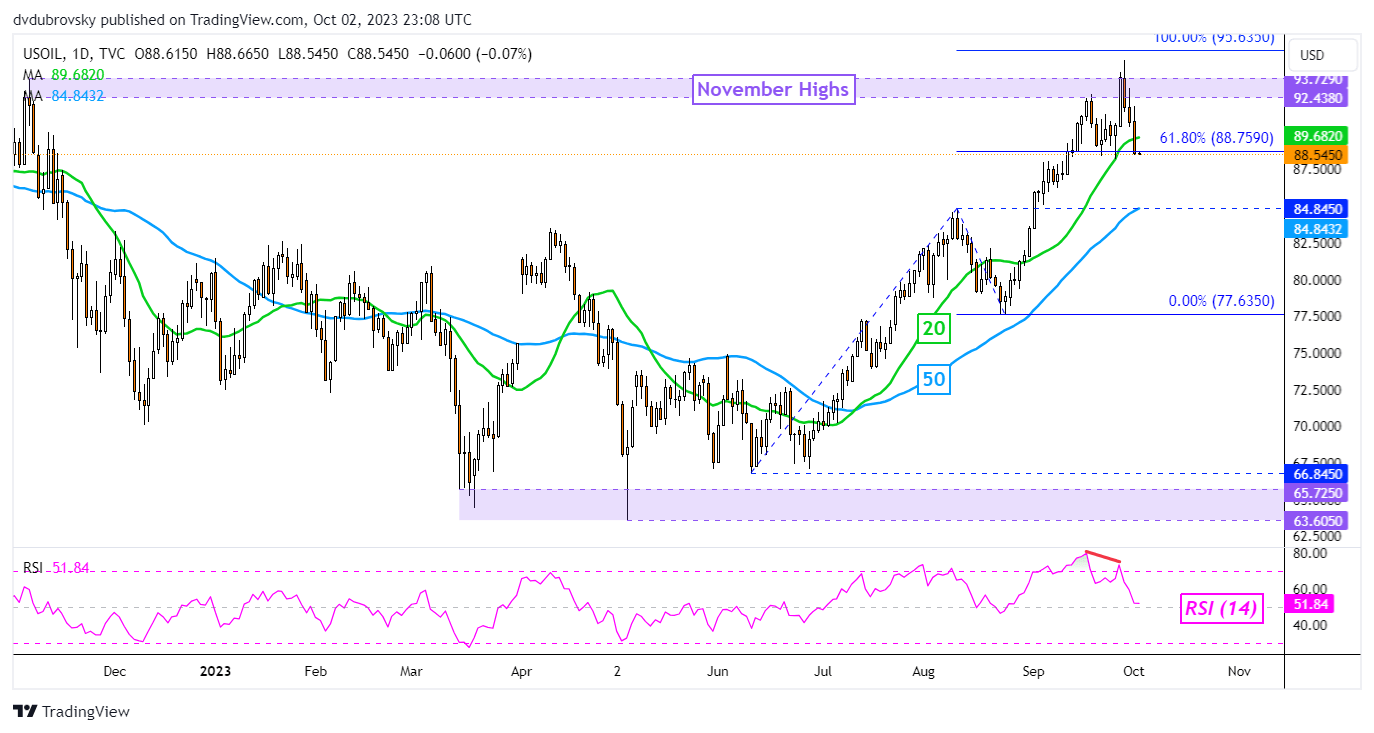
On the daily chart below, we can see that WTI has effectively rejected November highs, which make for a zone of resistance between 92.43 – 93.72. This also followed negative RSI divergence, which showed that upside momentum was fading. Since then, prices have extended lower, recently taking out the 20-day moving average.
Oil is also testing a push under the 61.8% Fibonacci extension level at 88.75. Confirming a breakout lower may open the door to an increasingly downward technical bias. Such an outcome places the focus on the 50-day moving average, and the 84.84 inflection point from August. These may hold as support.

Crude Oil Daily Chart
-- Written by Daniel Dubrovsky, Senior Strategist for DailyFX.com


