


Crude Oil, WTI, Retail Trader Positioning, Technical Analysis – IGCS Commodities Update
- Crude oil prices weakened over the past couple of days
- Retail traders are beginning to increase upside exposure
- Meanwhile, a Bearish Engulfing was confirmed, where to?

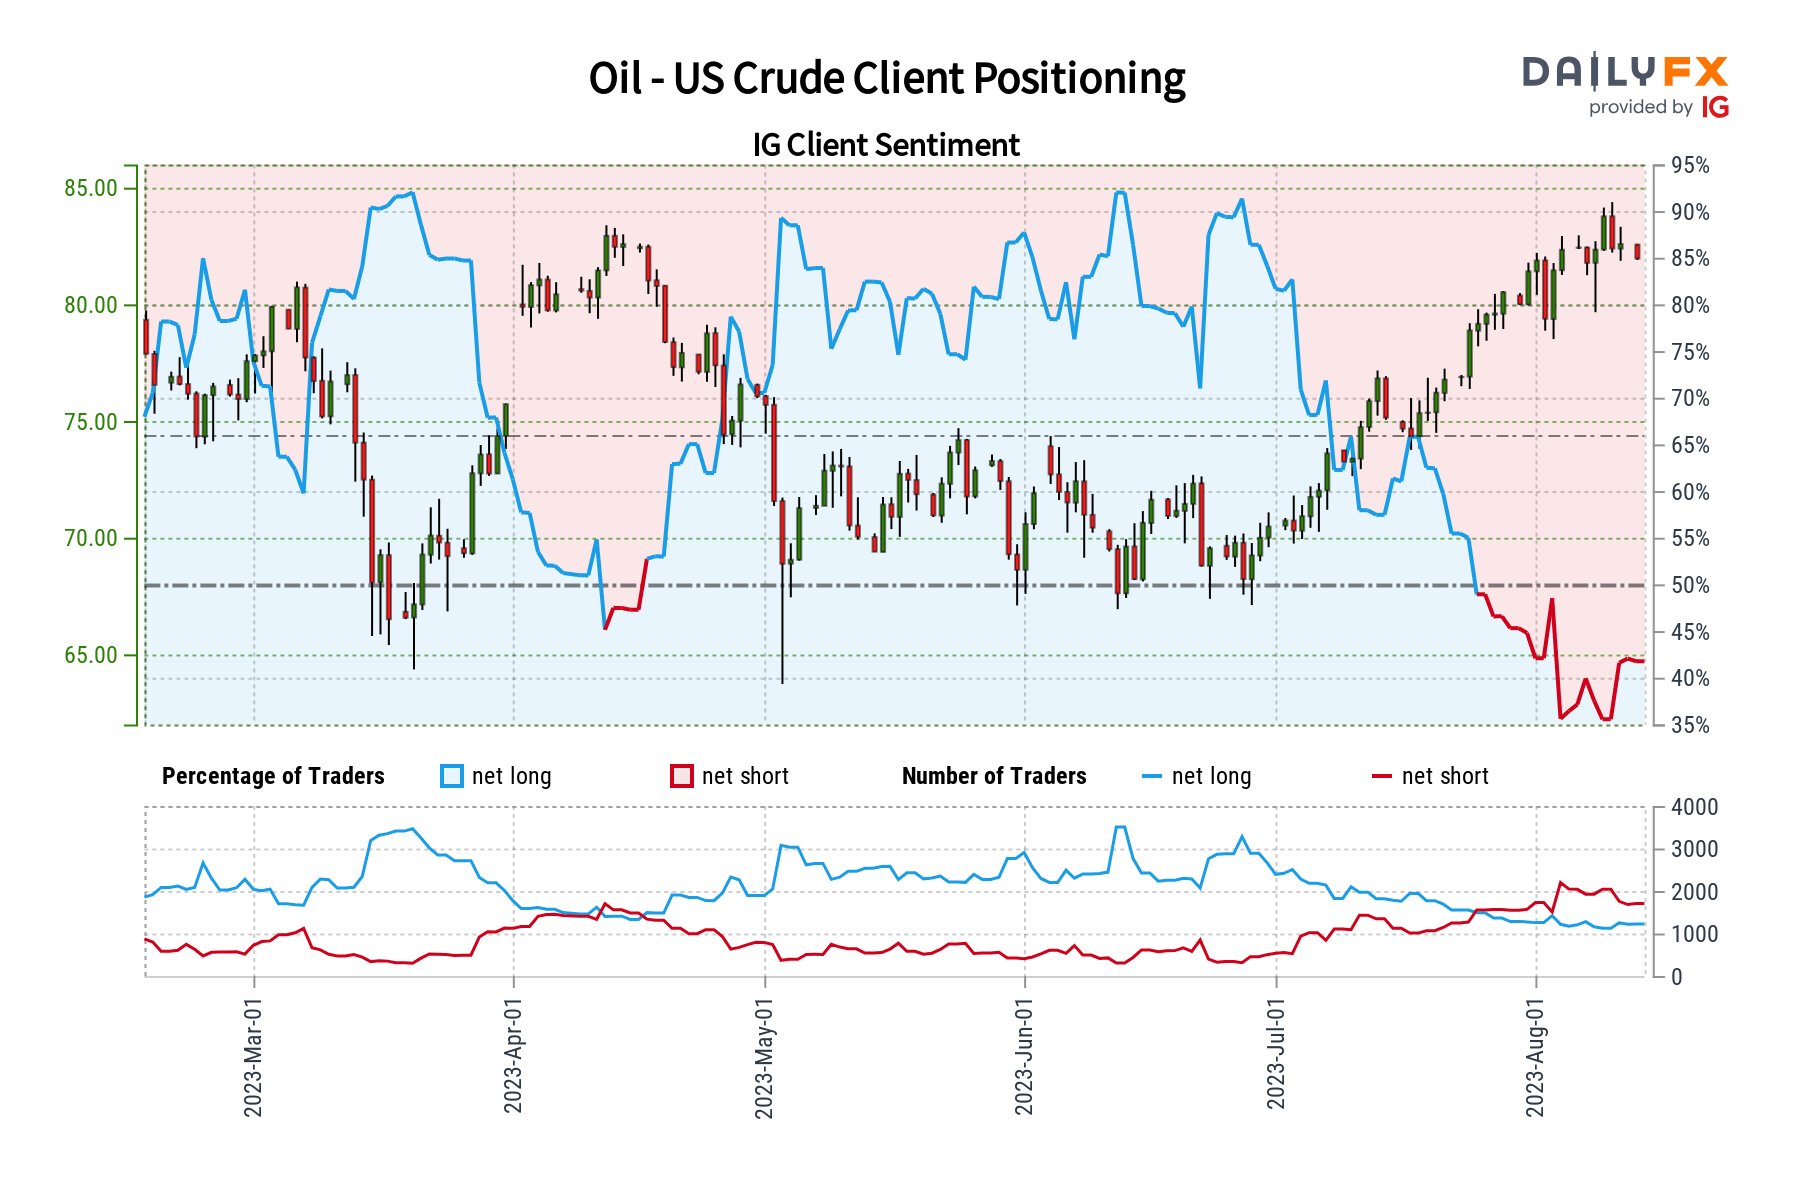
WTI crude oil prices have been aiming cautiously lower over the past couple of trading days. While the uptrend since June remains intact, it seems that retail traders are starting to show early signs of becoming more bullish on the commodity. This can be seen by taking a look at IG Client Sentiment (IGCS). IGCS typically tends to function as a contrarian indicator. With that in mind, if this near-term trend in positioning continues, could oil prices be at risk?
Crude Oil Sentiment Outlook - Bearish
According to IGCS, about 43% of retail traders are now net-long crude oil. The majority of them remain net-short which hints that prices may continue rising down the road. But, over the past 24 hours and compared to last week, downside exposure has decreased by 0.06% and 10.67%, respectively. With that in mind, recent changes in positioning hint that the price trend may soon reverse lower despite overall exposure.
| Change in | Longs | Shorts | OI |
| Daily | 0% | 11% | 3% |
| Weekly | -4% | -4% | -4% |
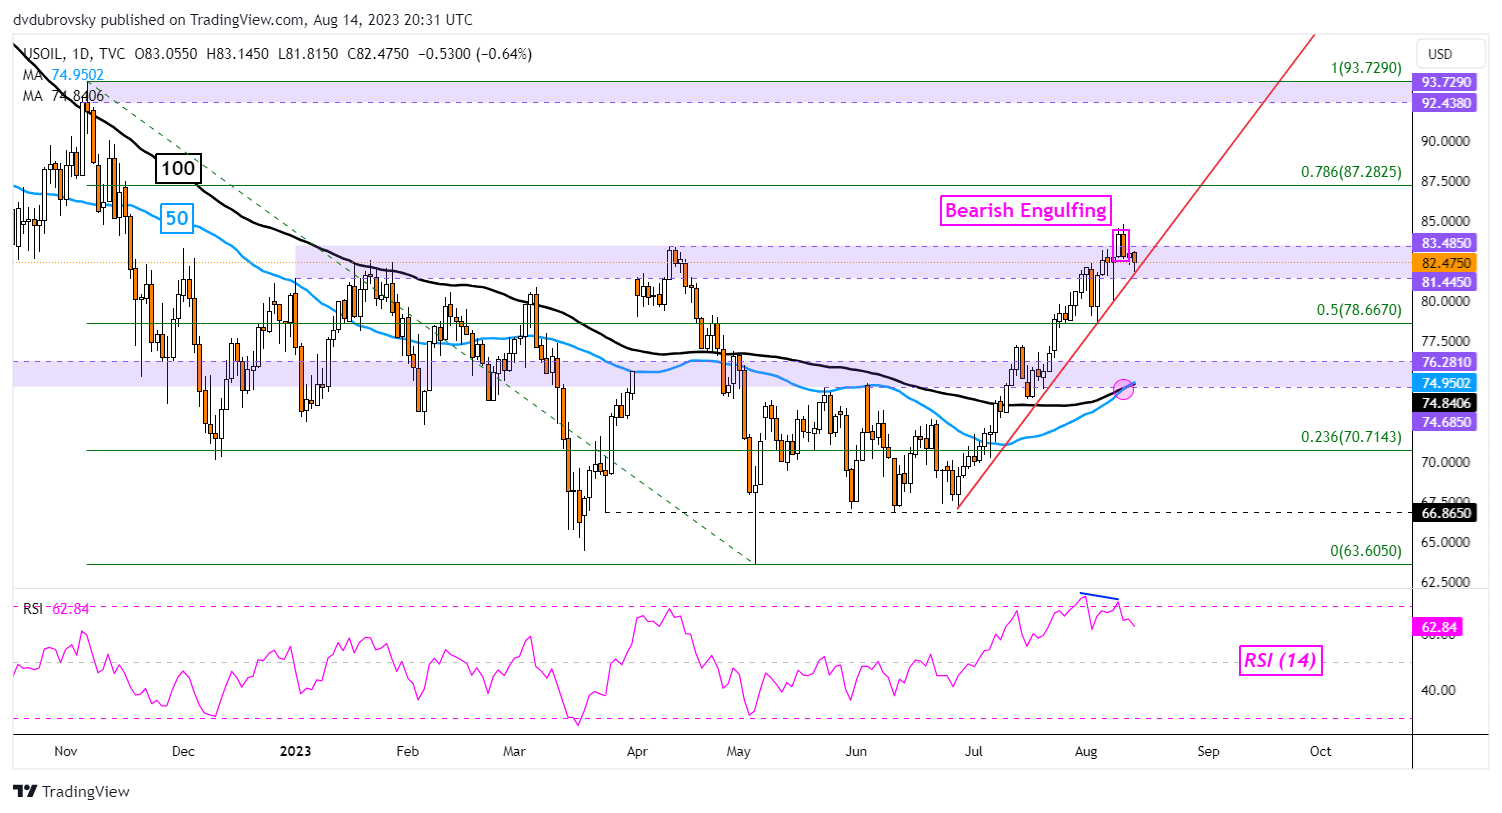
On the daily chart below, WTI crude oil has left behind a Bearish Engulfing candlestick pattern. This followed a failed breakout above the 81.44 – 83.48 resistance zone that was established over the past few months. Since the emergence of the candlestick pattern, prices have weakened further, confirming the Bearish Engulfing.
The false breakout also followed negative RSI divergence which was showing that upside momentum was fading. But, for the time being, prices remain above the rising trendline from June. On top of this, a bullish Golden Cross between the 50- and 100-day Moving Averages (MA) remains. As such, it would take further downside confirmation to underscore a bearish technical bias.

Crude Oil Daily Chart
-- Written by Daniel Dubrovsky, Senior Strategist for DailyFX.com


