


Crude Oil, WTI, Retail Trader Positioning, Technical Analysis – IGCS Commodities Update
- Crude oil prices on course for worst week since mid-March
- Retail traders recently turned net-long WTI, a bearish sign
- Prices broke under key moving averages, where too?

Crude oil prices are on course to sink nearly 7 percent this week so far. If confirmed, this could end up being the worst 5-day period for WTI since the middle of March. Retail traders are now increasingly boosting upside exposure. This can be seen by taking a look at IG Client Sentiment (IGCS), which could have a key influence on where the commodity goes from here.
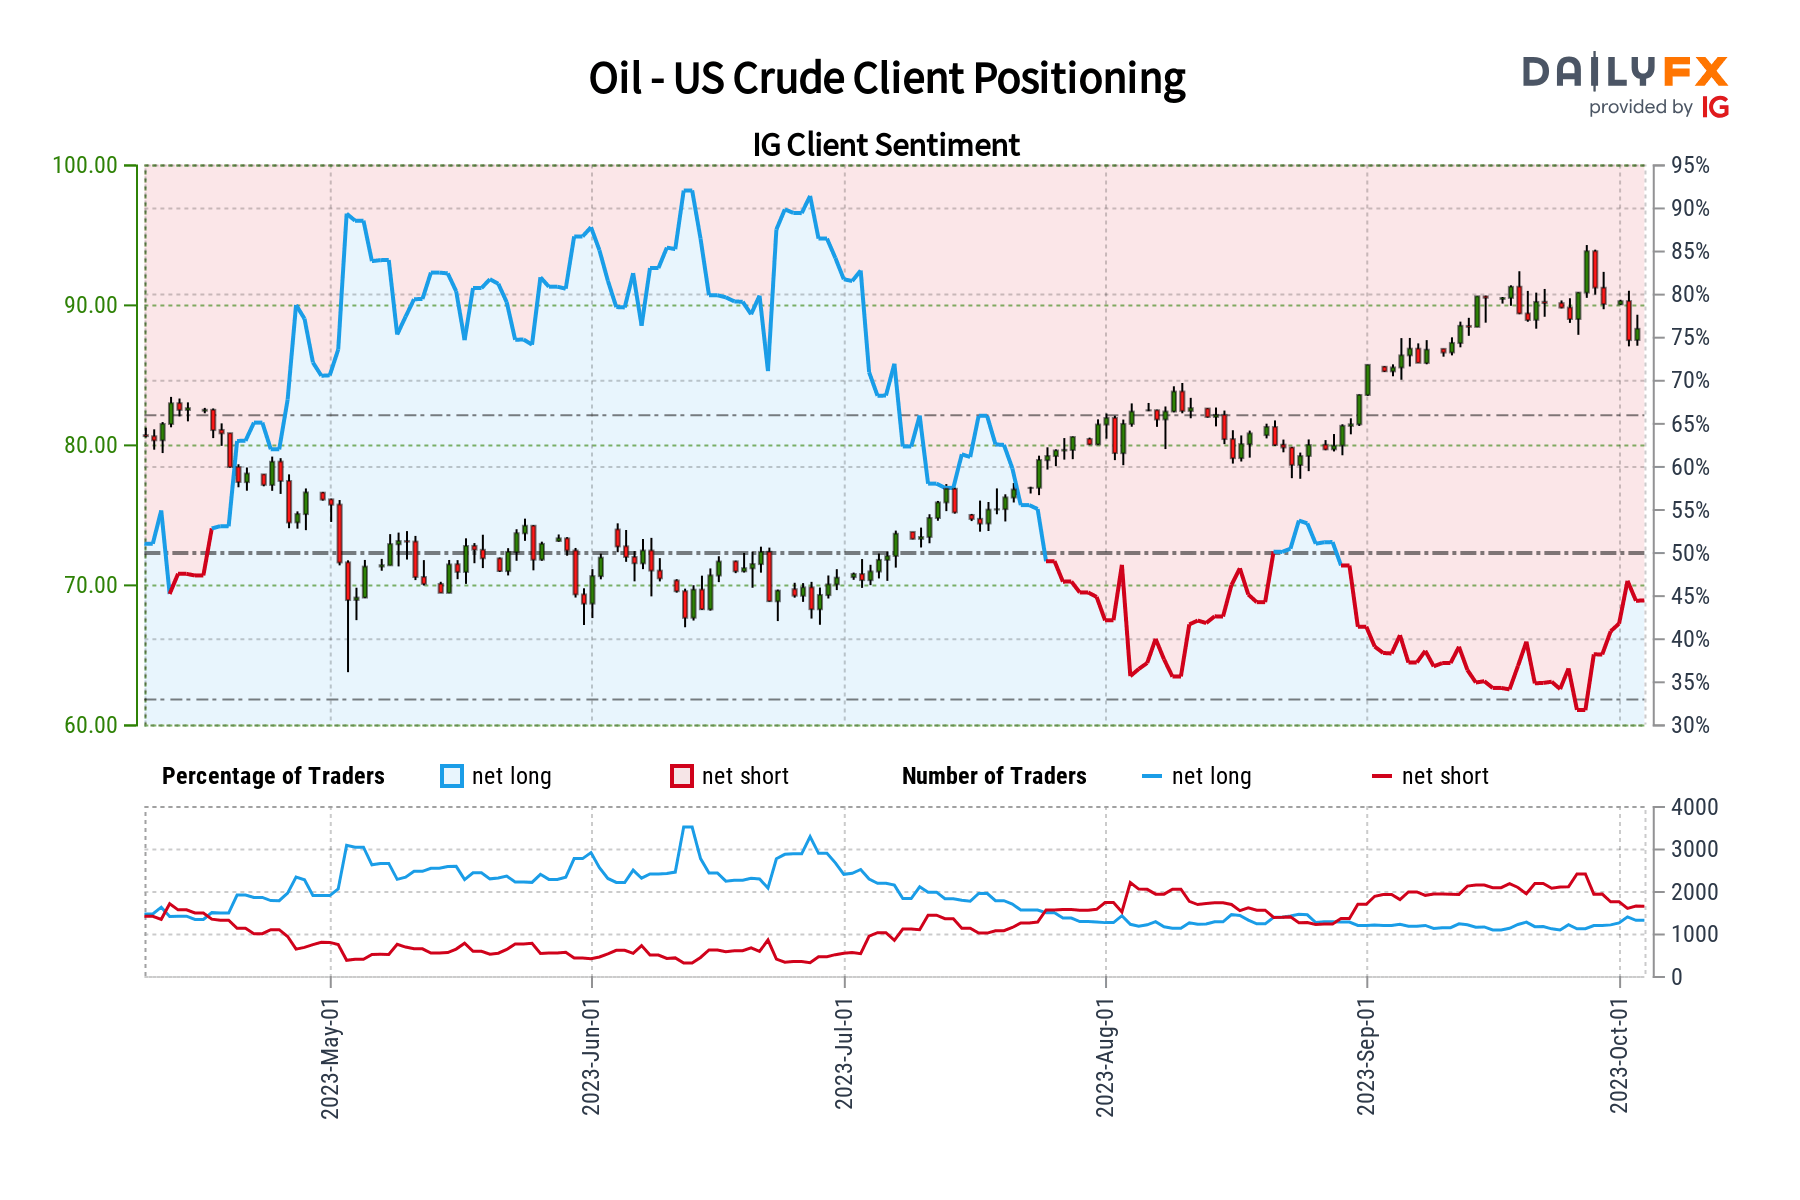
Crude Oil Sentiment Outlook - Bearish
According to IGCS, about 57% of retail traders are net-long crude oil. Since most of them remain net-long, this hints that prices may continue falling down the road. This is as upside bets increased by 33.08% and 67.76% compared to yesterday and last week, respectively. With that in mind, the combination of overall exposure and recent changes offers a stronger bearish contrarian trading bias.
| Change in | Longs | Shorts | OI |
| Daily | 3% | 5% | 4% |
| Weekly | 35% | -32% | 14% |
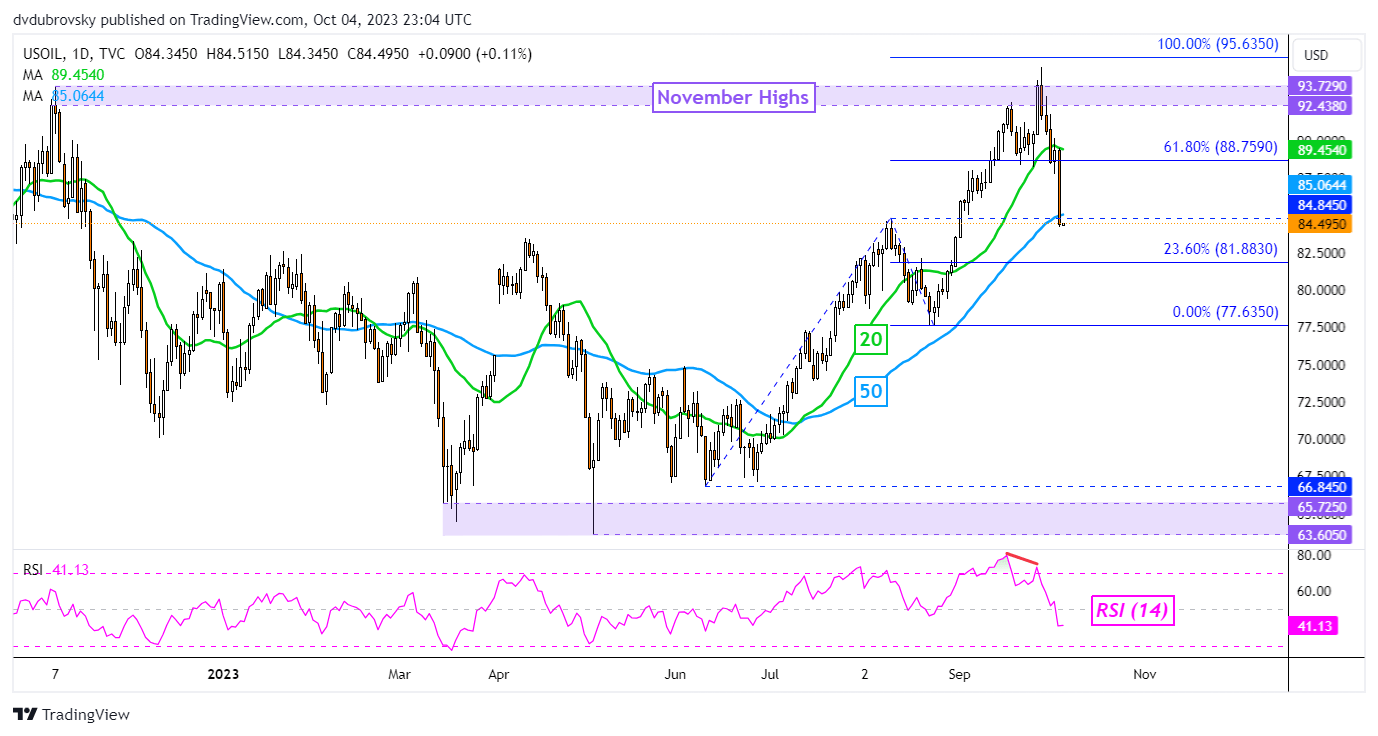
On the daily chart below, WTI has confirmed a breakout under the 20-day moving average and recently closed under the 50-day moving average. However, confirmation of a breakout under the latter has yet to be achieved. That said, recent losses followed negative RSI divergence, which showed that upside momentum was fading.
From here, recent losses have exposed the 23.6% Fibonacci extension level of 81.88, which is immediate support. Further losses beyond that place the focus on the August low of 77.63. Otherwise, in the event of a turn higher, keep a close eye on the 84.84 inflection point from the August peak.

Crude Oil Daily Chart
-- Written by Daniel Dubrovsky, Senior Strategist for DailyFX.com


