


Talking Points:
- Use Fibonacci to identify levels of support and resistance
- Use the Relative Strength Index (RSI) to confirm when a turn may be taking place
- Enter the trade with at least a 1:2 risk-to-reward ratio
Fibonacci retracement ratios have been used by traders for many years. The ratios can identify hidden levels of support and resistance as it identifies areas where a partial retracement may reverse. For those unfamiliar with Fibonacci, the common retracement ratios are 38.2%, 50%, 61.8%.
As traders are learning about the Fibonacci ratios for the first time, the next logical question the students ask is “how do I know which ratio to focus on?”
It is a good question and the market’s price action will provide a clue if a particular Fibonacci retracement ratio is likely to be respected creating a market turn.
Said another way, rather than blindly entering into a trade because it hit a particular retracement ratio, how about if we let the market provide us confirmation signals that it is likely to turn?
We can use the Relative Strength Index (RSI) to help us confirm if a Fibonacci ratio is repelling prices.
(If you would like to learn more about the RSI and how to apply it to your charts, register for this free 20 minute course. In it, you will learn how to read and filter signals provided by the RSI. Register here to start your learning.)
Learn Forex: RSI Confirmation of a Fibonacci Retracement Level
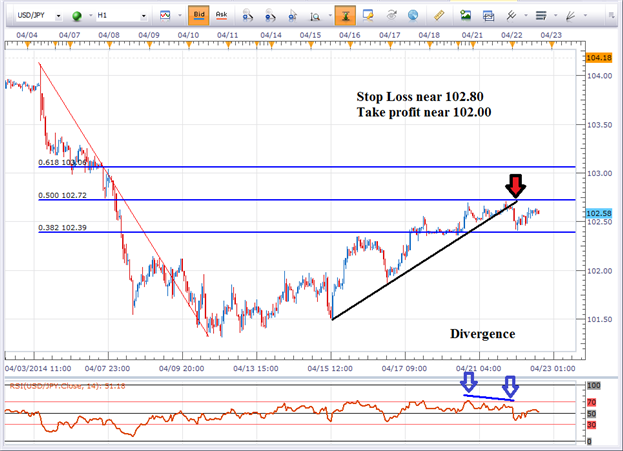
(Created using FXCM’s Marketscope 2.0 charts)
As we can see above, the USD/JPY has the three Fibonacci retracement levels added to the chart (horizontal blue lines). The first level, the 38.2% level, barely resisted prices.
However, we can now see that the 50% level is providing some resistance. Additionally, the RSI is showing divergence which is a bearish signal as well.
Divergence is where the price makes higher highs, but the oscillator makes lower highs. Divergence means that momentum is slowing. Slowing momentum into a resistance level is a good recipe for a trading opportunity.
When prices fell below the black support trend line, which is further confirmation that the temporary uptrend is losing momentum. A trader would enter on a break of the black trend line, then place the stop loss just above the recent swing high.
Look to take profits at a distance at least twice the size of the distance to your stop loss. This will give you a 1:2 risk to reward ratio.
Let the trade evolve until it reaches your stop loss or take profit level.
Risk a small portion of your account balance, less than 5%, on all open trades.
(To learn more about risk-to-reward ratios, money management, and timing trades, we recommend you check out our three forex courses to help you trade like a professional.)
Good luck and happy trading!
---Written by Jeremy Wagner, Head Trading Instructor, DailyFX
Add me to your Google + Forex Circle.
Follow me on Twitter at @JWagnerFXTrader .
To be added to Jeremy’s e-mail distribution list, click HERE and select SUBSCRIBE then enter in your email information.
See Jeremy’s recent articles at his DailyFX Forex Educators Bio Page.


