


Talking Points:
- Retracement traders look for Oversold values in an uptrend
- The trend can be determined using a 200MVA
- Entries in an uptrend can be signaled by new momentum
The Euro has continued its ascent against the US Dollar into the 2014 trading year. Retracement traders have been waiting for a pull back from its standing high at 1.3966 for an opportunity to enter into the market. One way to trade a retracement strategy is to first identify the trend, and then by using an oscillator to determine an oversold or overbought area for entry. Today we will examine the EURUSD as it potentially reaches an oversold value using the CCI oscillator.
The EURUSD Trend
There are many ways to identify the trend for the EURUSD, but one of the easiest methodologies is through the use of a 200 period MVA (Simple Moving Average) on a daily chart. This indicator looks back 200 periods and finds the average price for the selected periods. The key here is to find if price is advancing faster than the average.
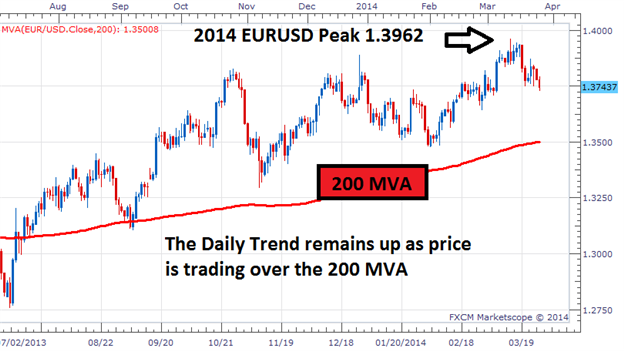
Depicted below not only do we see the 2014 high on the EURUSD, but a series of highs as price has progressed up the chart. This momentum has helped propel the pair above, and stay above, the 200period MVA. Knowing now that the trend is up, traders can look for fresh buying opportunities on pullbacks in price.
Learn Forex: EURUSD & 200 MVA
Entries with CCI
Next we will look at the same EURUSD chart, but this time the CCI indicator will be attached. This oscillator is used to help determine when price is overbought and oversold in the market place. In an uptrend like the EURUSD daily chart, traders will wait for price to retrace pushing the indicator below -100 (indicating an oversold condition). With price reaching a relative low, it can allow traders then to buy the market at a cheaper price on a return of market momentum.
Below we can see several opportunities previously presented to buy the EURUSD using the CCI indicator. When looking at present price, we can see a retracement now attempting to push CCI back below the designated oversold value. In the event price becomes oversold, traders will wait for momentum to turn and place fresh entries on a CCI crossover.
This is just one of many ways traders can trade using an oscillating indicator such as CCI. To learn your next CCI strategy, feel free to take our course on the subject. You will be asked to sing the guestbook, which is completely free and you will be met with video based lessons on the subject via Brainshark.
CCI Training and Strategies via Brainshark
Learn Forex: EURUSD & CCI

(Created using FXCM’s Marketscope charts)
---Written by Walker England, Trading Instructor
To contact Walker, email instructor@dailyfx.com. Follow me on Twitter at @WEnglandFX.
To be added to Walker’s e-mail distribution list, CLICK HERE and enter in your email information
New to the FX market? Save hours in figuring out what FOREX trading is all about. Take this free 20 minute “New to FX” course presented by DailyFX Education. In the course, you will learn about the basics of a FOREX transaction, what leverage is, and how to determine an appropriate amount of leverage for your trading.
Register HERE to start your FOREX learning now!


