


Two weeks ago in our DailyFX Live Trading Room we conducted a webinar on Multiple Time Frame Analysis. Yesterday we held another live session on the topic and it has generated quite a bit of interest.
For those of you who may have missed it or were unaware of it (more on how you can become a participant in the Trading Room later), below is a synopsis of how it can be utilized.
Since a currency pair is moving across numerous time frames simultaneously, Daily, 4 hour and 1 hour for example, it is beneficial for a trader to wait to enter a trade until the smaller time frames are in agreement with the larger time frame.
The whole process regarding trading in general and Multiple Timeframe Analysis (MTFA) specifically begins by identifying the trend…the direction in which the market has been moving the pair over time. For our purposes here, the trend can be identified on the Daily chart.
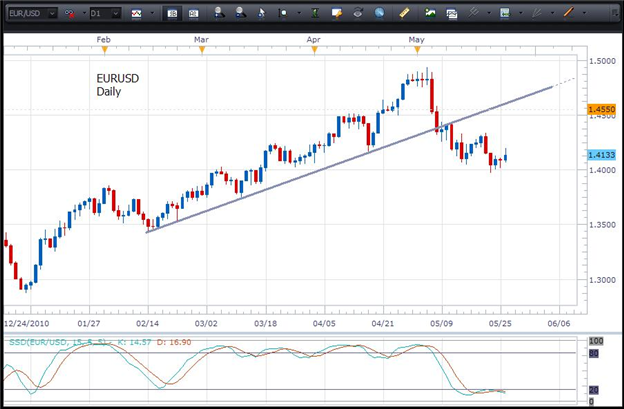
Taking a look below at the Daily chart of the EURUSD which goes back to February, we can see that the pair has broken through trendline support and has been posting lower highs and lower lows. Also, Slow Stochastics is below 20 with the faster K line below the slower D line…both of those are bearish signs. Based on this, we know that we only want to sell the pair.
So now that we know the direction we want to trade the pair, we go down to a lower time frame to “fine tune” the entry. The 4 hour chart on the EURUSD below shows how the pair moved to the upside (retraced) and now is poised, potentially, to move back to the downside in the direction of the trend we identified on the Daily chart. Using Slow Stochastics to identify when downside (bearish) momentum takes hold, we would enter when both the K and the D line of Slow Stochastics cross below 80.

Since the 4 hour chart is providing what I consider an optimum entry signal, I would not refine the entry further by consulting the 1 hour chart. (If the 4 hour chart was giving mixed messages, however, I would drill down to the 1 hour to see if the entry could be further optimized.)
In a nutshell, to implement MTFA in our trading, after we establish the trend, we want to check several lower time frame charts and not enter the trade until they are in agreement with the longer term chart that we used to establish the trend. Once the time frames are in agreement, it is like aligning the tumblers in a lock so the lock may freely open.
Below is a visual that may assist in understanding the concept…


