


Talking Points:
- This article is an extension of our previous piece on Support and Resistance in the FX Market.
- We look at the history and background of the mathematical concept known as ‘The Fibonacci Sequence’
- We show you how traders can apply these mathematical studies to their trading.
In our last article we looked at Static Support and Resistance in the Forex Market. These methods are objective and non-negotiable in identifying potential price levels at which price action may stall or reverse.
In this article, we’re going to look at a more subjective form of Support and Resistance analysis: We’re going to investigate Fibonacci. In our next three pieces, we’ll take all of these support and resistance mechanisms and we’ll show you how traders can actually put them to use.
Fibonacci
This is one of the more in-depth support and resistance methods out there, and there are a lot of different ways that traders look to integrate Fibonacci in their trading.
Taking a step back, Fibonacci is named after the 12th century mathematician, Leonardo of Pisa. In 1202 AD, Leonardo published a composition with the name of Liber Abaci that consisted of a numerical sequence that eventually became named after him. Leonardo of Pisa didn’t discover the sequence; he merely used it as an example in his composition.
The sequence is thought to have been originally used by Indian mathematicians as early as the 6th century; and in Liber Abaci, this numerical sequence was introduced the western world. The sequence introduced by Leonardo of Pisa was a system that found the next value in the sequence by adding the two previous numbers. The sequence shared in Liber Abaci was as follows:
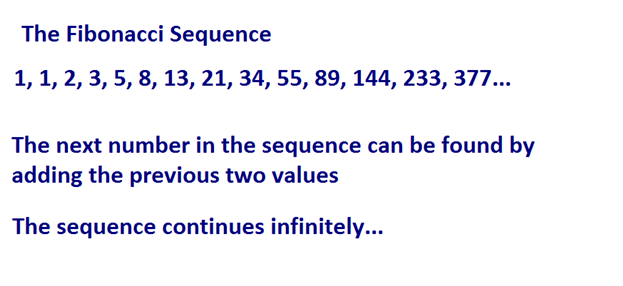
Today these values are called ‘Fibonacci numbers’ and are used by many traders as input values for indicators along with a slew of other purposes. As an example, my own ‘fingertrap’ short-term strategy consists of Moving Averages using numbers from the Fibonacci sequence.
But input values on trading indicators aren’t the only place that we’ll see this system at work. The Fibonacci sequence has excited mathematicians and scientists for thousands of years because of its numerous applications in the world around us. One of the initial applications that Leonardo of Pisa investigated in his original manuscript was the population growth of rabbits. He found that as an isolated population of rabbits grew, the population would grow according the Fibonacci sequence. Starting with one pair of rabbits, the population would then grow to two; which would become three, and then five, eight, thirteen, etc. The sequence is also prominent in population growth within honeybees, the number of petals on a flower, and the formation of pine cones just to name a few.
Many believe the Fibonacci sequence to be the language of nature itself. If you want to see more on this topic, Fibonacci was prominently featured as part of the movie Pi; the fictional movie released in 1998 that follows a mathematician’s quest in predicting the future based on mathematics. But even outside of fictional movies, the numerous manners with which the sequence appears in the world around us is fascinating and definitely worthy of a google-search.
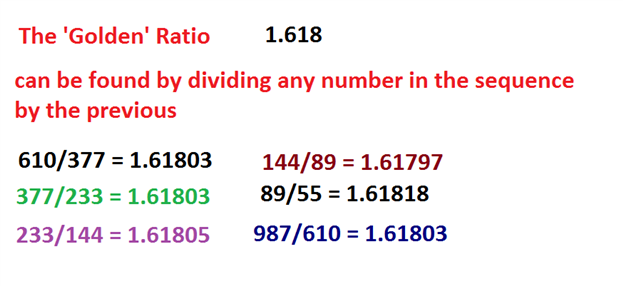
But that’s not the only exciting aspect of the Fibonacci sequence. More fascinating is what we can see if we look just a little bit below the surface. If you take the ratio of any two successive numbers, such as 144 and 233 and divide the second number (233) by the first (144), you’ll eventually move towards a very special number of 1.618 (61.8%). In this specific example, the exact value would be ‘1.6180555…’ The deeper we get in the sequence, the closer this ratio moves towards 1.618 until eventually the ratio stands at exactly 1.618. This number is the prize behind Fibonacci, and it has fascinated mathematicians and scientists for thousands of years.
The number of 1.618 is called ‘The Golden Ratio,’ and can be found in numerous applications within nature ranging from the spirals of a sea shell to leaf arrangements of a houseplant.
Trading with Fibonacci (and the Golden Ratio)
Traders will often employ Fibonacci when looking to trade retracements in a trend, centering support and resistance levels around intervals defined by the Golden Ratio of 1.618.
The center of Fibonacci analysis is at the .618 interval of the trend, taken directly from the golden ratio. But we can take this a step further by dividing a number in the sequence by the number located two figures to further. If we take 34 and divide that number by 89; or if we take 133 and divide that by 377, we consistently receive values of ~.382 (38.2%). This is the next value that traders will plot via Fibonacci analysis.
We can then do the same thing with by dividing any number in the sequence with the digit located two places further. So, for example, if we divide 34 by 144; or if we divide 55 by 233, we consistently receive values of ~.236 (23.6%). Traders have taken this a step further to examine the mid-line of the move (.50, or 50%), and .786 (78.6% - or the reciprocal of .236). The finished result is what we have below using the weekly GBPUSD chart:
Fibonacci retracement on GBPUSD weekly chart
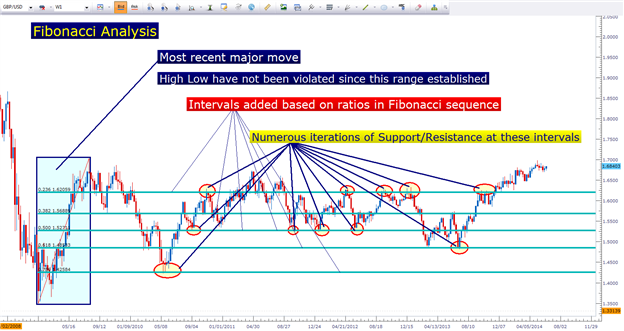
Created with Marketscope/Trading Station II
As you can see in the above chart, these price levels on a chart can exhibit phenomenal examples of support and/or resistance coming in the market place. And luckily for us, using Fibonacci as a trader is significantly easier than proving any ‘magical’ components behind it as mathematicians have attempted to do for the past couple thousand years.
To use Fibonacci, a trader needs to merely identify a most recent ‘major move.’ This is where subjectivity comes in to play. This major move can be on the 5-minute chart, the hourly chart, or the weekly chart (as we had done with GBPUSD above). But like we saw with Pivot Points, longer-terms and more data generally brings more value to the analysis simply because more traders may be seeing it. If we draw a Fibonacci retracement on a 5-minute chart; it might be seen by a few other traders whereas a retracement taken from the weekly chart will likely generate more interest from traders simply because it encapsulates significantly more data.
Traders can use the Fibonacci tool available in most trading platforms to define the move, and then levels at the proper intervals of .236, .382, .500, .618, and .786 can be drawn in. So, when prices move down to the .236 line, we can say that 23.6% of that trend has been retraced. Or if prices move down the .618 level, 61.8% of the trend has been re-traced.
Fib can be applied very easily with most modern trading platforms
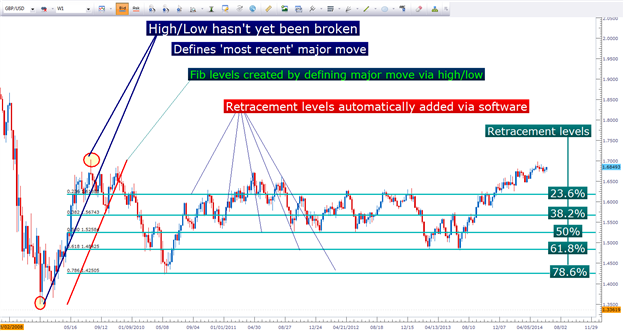
Created with Marketscope/Trading Station II
If you’d like to get more familiar with trading Fibonacci, we have a variety of resources available here for you from DailyFX.
We have a full course available on this field of analysis via the Brainshark medium. This is completely free-of-charge and can be started from the link below:
Brainshark Link for ‘Trading with Fibonacci’ Course
We also have numerous articles on the topic, as this is a very popular field of support and resistance analysis. My colleague Walker England authored ‘How to Trade Fibs in Forex,’ and I took more of a trend-based approach in the article, Trading Trends with Fibonacci.
--- Written by James Stanley
Before employing any of the mentioned methods, traders should first test on a demo account. The demo account is free; features live prices, and can be a phenomenal testing ground for new strategies and methods. Click here to sign up for a free demo account through FXCM.
James is available on Twitter @JStanleyFX
Are you looking to take your trading to the next level? The DailyFX 360° Course offers a full curriculum, along with private, weekly webinars in which we walk traders through dynamic market conditions using the education taught in the course.
Would you like to trade alongside seasoned professionals throughout the trading day? DailyFX On Demand gives you access to DailyFX Analysts during the most active periods of the trading day.
Would you like to enhance your FX Education? DailyFX has recently launched DailyFX University; which is completely free to any and all traders!


