
NASDAQ 100, GOLD PRICE (XAU/USD) FORECAST:
- Gold prices retreat, dragged lower by U.S. dollar strength and rising yields
- The Nasdaq 100 also loses ground, sinking to an important support area
- This article focuses on the technical outlook for gold (XAU/USD) and the Nasdaq 100, analyzing price action dynamics and market sentiment
Trade Smarter - Sign up for the DailyFX Newsletter
Receive timely and compelling market commentary from the DailyFX team
Most Read: US Dollar Comes Alive as Yields Fly, Setups on EUR/USD, GBP/USD and USD/JPY
Gold prices (XAU/USD) retreated moderately on Tuesday, succumbing to rising rates and the commanding resurgence of the U.S. dollar, which climbed sharply following a poor performance last month, just as the curtain rose on the first trading session of 2024.
The Nasdaq 100 also suffered a setback, plummeting 1.7% to 16,543, posting its biggest daily decline since late October, weighed down by the substantial rally in U.S. Treasury yields.
After a strong finish to 2023 for the yellow metal and the technology index, traders adopted a cautious stance at the start of the new year, trimming exposure to both assets for fear of a larger pullback ahead of high-profile events in the coming days.
Focusing on key catalysts later this week, Wednesday brings the ISM manufacturing PMI, followed by U.S. employment numbers on Friday. These reports may give Wall Street the opportunity to assess the broader economic outlook and determine if aggressive easing expectations are justified.
Outlined below are investor projections for both the ISM and NFP surveys.
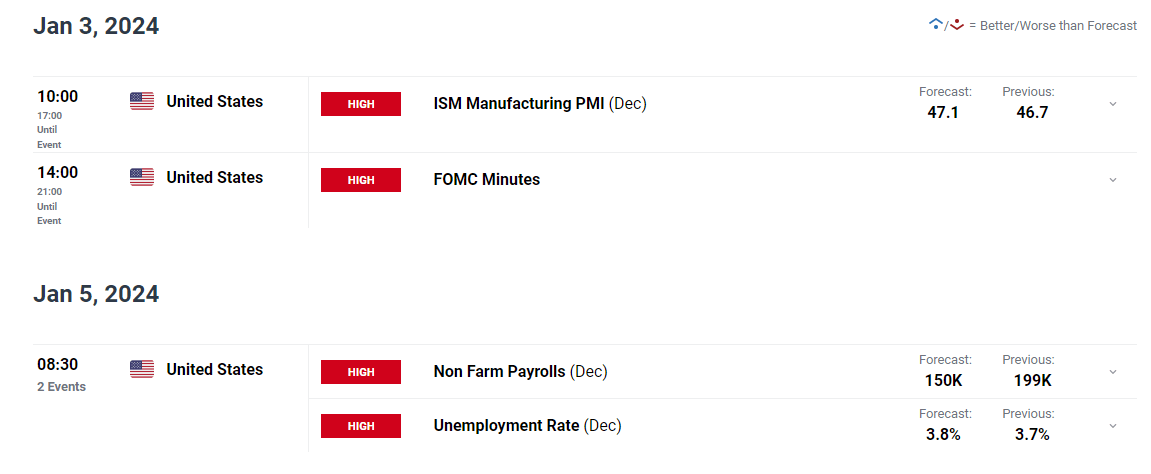
Source: DailyFX Economic Calendar
In the grand scheme of things, subpar economic figures will be supportive of tech stocks and gold prices by affirming expectations for aggressive rate cuts. Conversely, robust data might trigger an opposing response, leading bullion and the Nasdaq 100 lower as traders dial back their bold rate cut forecasts.
For an extensive analysis of gold’s medium-term prospects, which incorporate insights from fundamental and technical viewpoints, download our Q1 trading forecast now!

GOLD TECHNICAL ANALYSIS
Gold trended lower on Tuesday, slighting for the third straight session after prices failed to clear a key resistance in the $2075-$2,085 region. If the precious metal extends its retracement in the coming days, support appears at $2,050-$2,045. Bulls must defend this floor tooth and nail – failure to do so could send XAU/USD reeling towards $2,010, near the 50-day simple moving average.
Conversely, if buyers regain the upper hand and propel prices upward, the first line of defense against a bullish attack emerges at $2075-$2,085. Previous attempts to break through this ceiling have been unsuccessful, so history could repeat itself in a retest, but in the event of a sustained breakout, the all-time high at $2,150 would be in play again.
GOLD PRICE TECHNICAL CHART
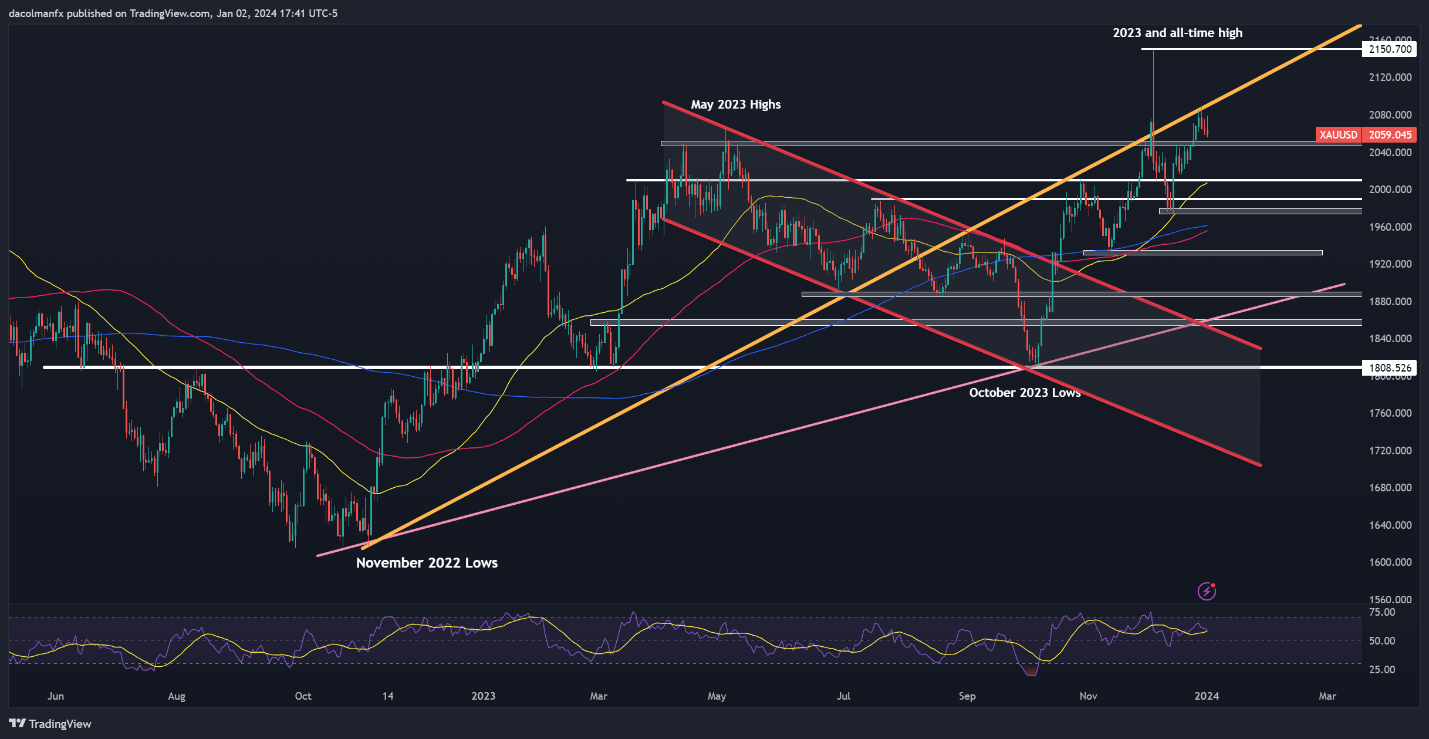
Gold Price Chart Created Using TradingView
If you're looking for an in-depth analysis of U.S. equity indices, our first-quarter stock market outlook is packed with great fundamental and technical insights. Get it now!

NASDAQ 100 TECHNICAL ANALYSIS
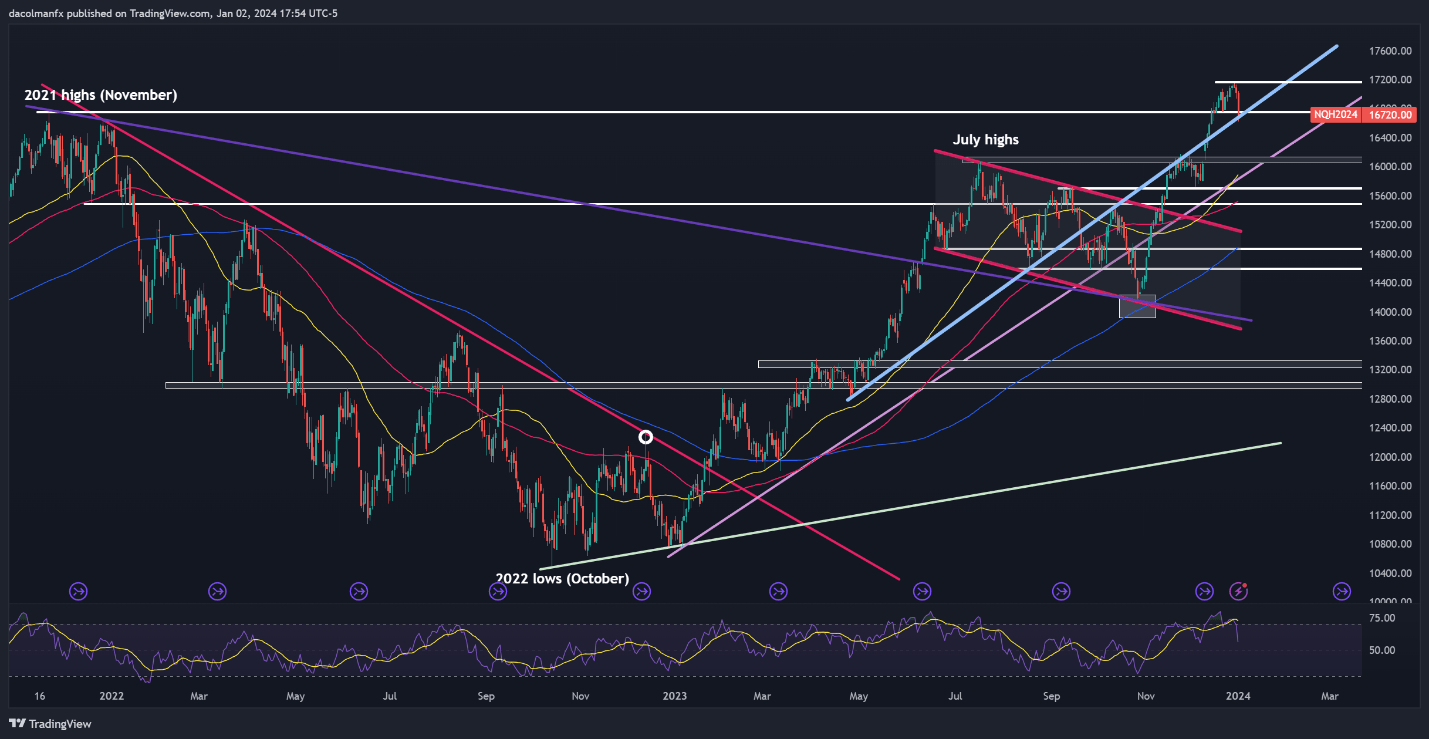
The Nasdaq 100 fell sharply on Tuesday, yet it narrowly avoided breaching confluence support positioned near the 16,700 area. To preserve bullish aspirations for a new record, this technical floor must be maintained at all costs; failure to do so might prompt a deeper downward move, with the next area of interest located at 16,150.
On the flip side, if market sentiment stabilizes and gives way to a steady rebound in the upcoming trading sessions, overhead resistance looms at 17,165. If history is any guide, the Nasdaq 100 could be rejected lower from this ceiling on a retest, but a breakout could trigger a rally toward 17,500, which would represent a new milestone for the tech index.
NASDAQ 100 TECHNICAL CHART