
For an extensive analysis of gold’s medium-term fundamental and technical outlook, download our quarterly trading forecast now!

GOLD PRICE FORECAST – TECHNICAL ANALYSIS
Gold (XAU/USD) dropped sharply on Wednesday, but managed to hold above support at $2,375. Bulls need to defend this technical floor tenaciously to avoid a deeper retrenchment; failure to do so could lead to a move towards $2,360. If weakness persists, the focus will shift to $2,335, the 38.2% Fibonacci retracement of the 2024 rally.
In the event of a bullish reversal from current levels, buyers may feel emboldened to initiate a push towards $2,420. On further strength, attention is likely to gravitate towards $2,430. Overcoming this barrier may be challenging, but a breakout could potentially usher in a rally toward the all-time high located in the vicinity of $2,450.
GOLD PRICE TECHNICAL CHART
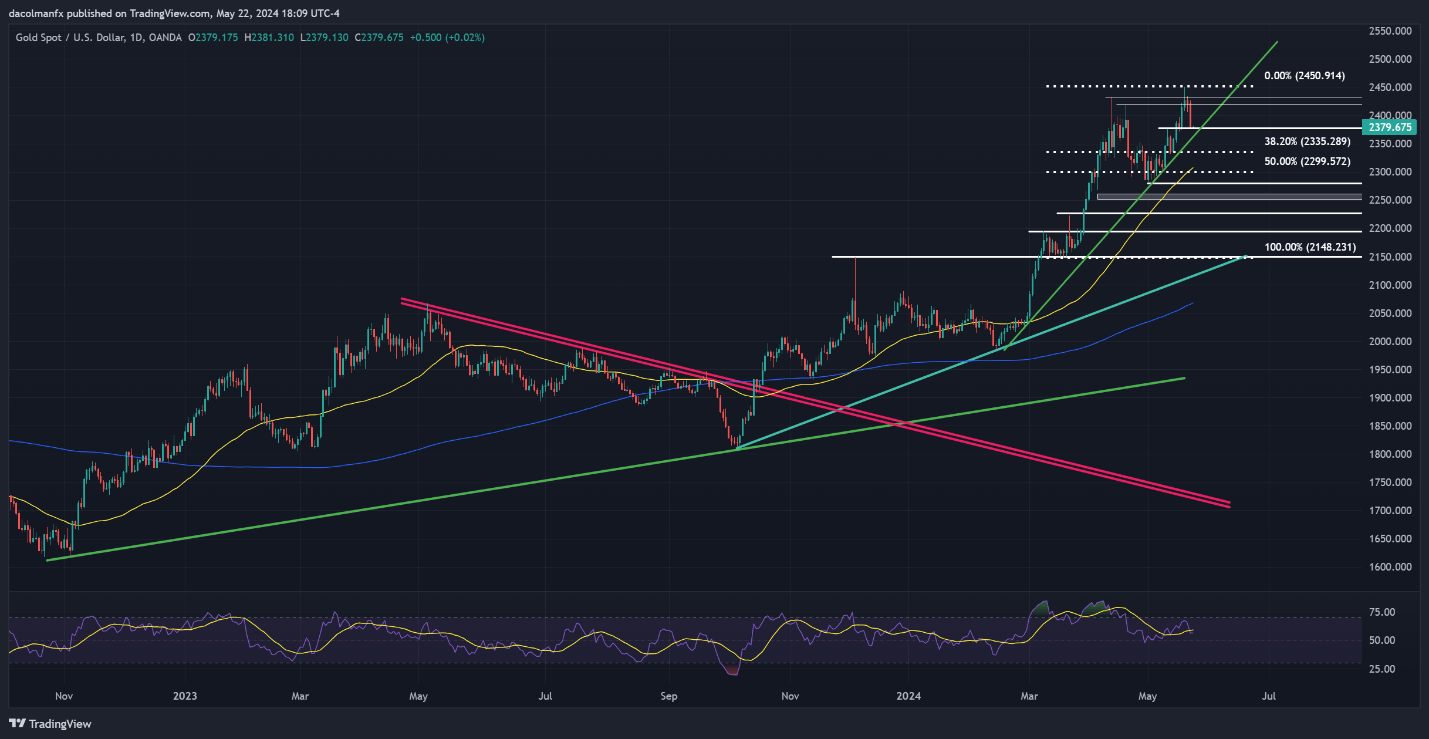
Gold Price Chart Created Using TradingView
Stay ahead of the curve and improve your trading prowess! Download the EUR/USD forecast for a thorough overview of the pair’s technical and fundamental outlook.

EUR/USD FORECAST - TECHNICAL ANALYSIS
EUR/USD continued to decline on Wednesday, approaching a key support zone at 1.0810. To sustain a bullish outlook against the U.S. dollar, the euro must stay above this threshold; loss of this floor could trigger a retreat towards the 200-day simple moving average at 1.0790. Further weakness would then put the spotlight on 1.0725.
In the scenario of a bullish turnaround, the first major resistance worth watching emerges at 1.0865, where a crucial trendline intersects with the 50% Fibonacci retracement of the 2023 decline. Overcoming this technical obstacle won't be easy, but a successful breakout could see bulls targeting 1.0980, the March swing high.
EUR/USD PRICE ACTION CHART
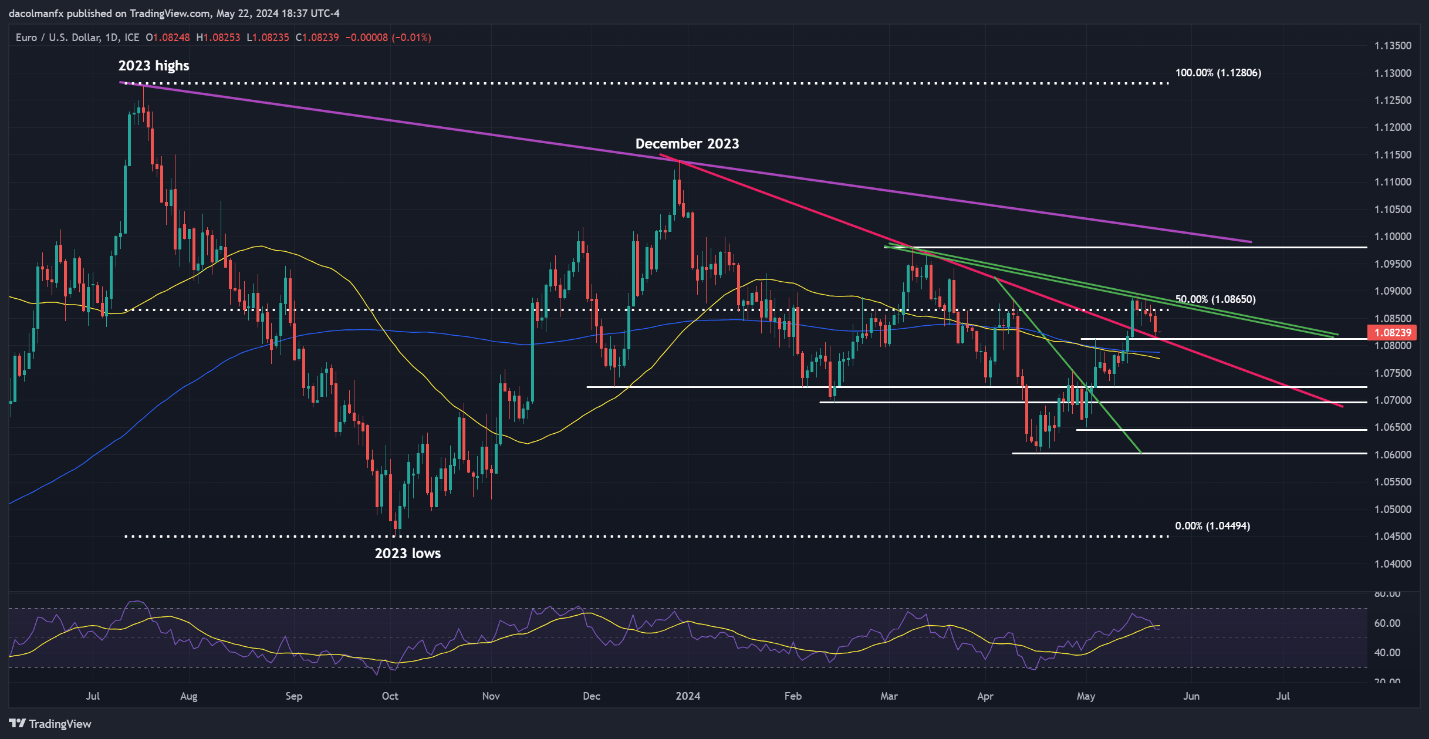
EUR/USD Chart Created Using TradingView
For a complete overview of the USD/JPY’s technical and fundamental outlook, make sure to download our complimentary quarterly forecast!

USD/JPY FORECAST – TECHNICAL ANALYSIS
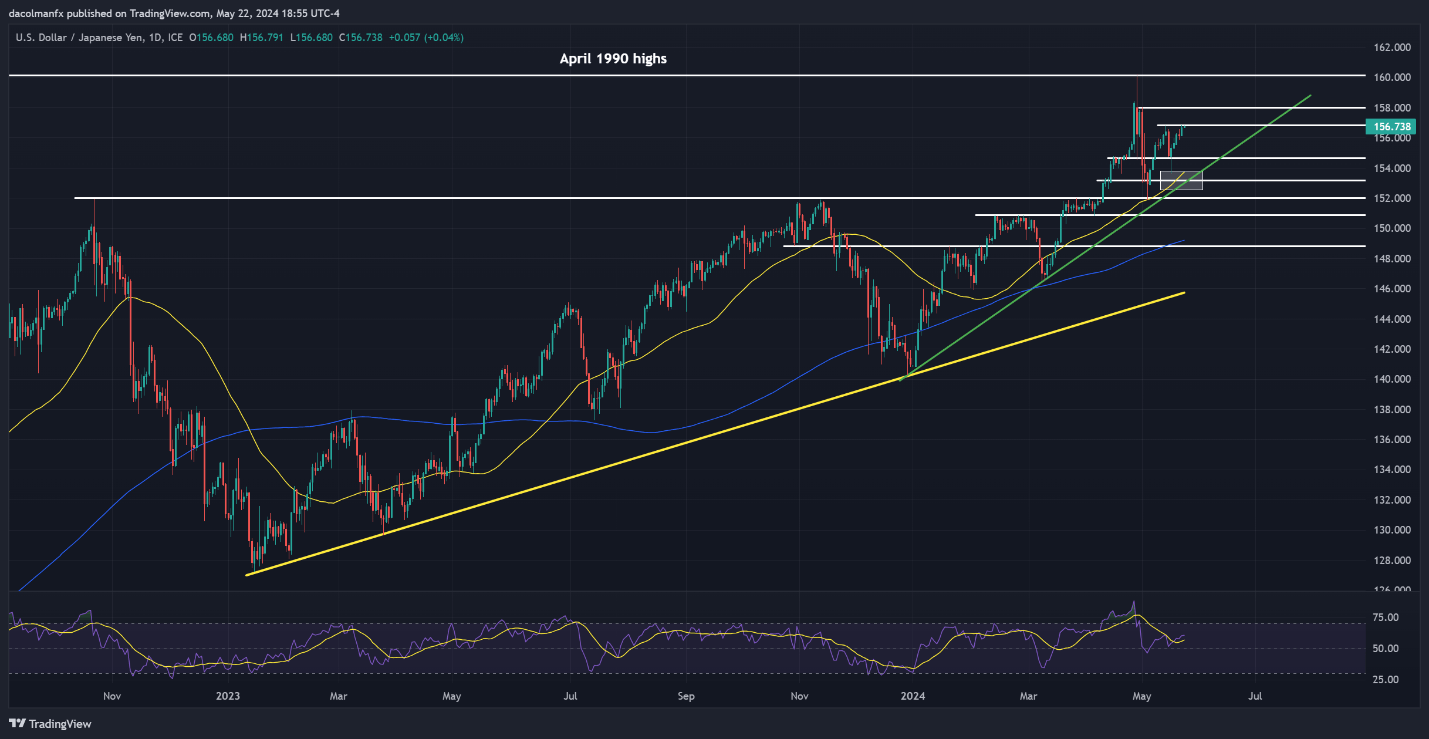
USD/JPY pushed higher on Wednesday, closing in on horizontal resistance at 156.80. Bears must defend this barrier diligently; failure could pave the way for a climb to 158.00 and eventually 160.00. Any advance to these levels should be approached with caution due to the risk of intervention by Japanese authorities to bolster the yen, which could cause a sharp downward reversal.
Conversely, if sellers mount a comeback and spark a bearish swing, initial support looms at 154.65. While the pair is expected to stabilize around these levels during a pullback, a breach might lead to a swift descent toward the 50-day simple moving average at 153.75. Further losses from there could expose trendline support just above the 153.00 mark.
USD/JPY PRICE ACTION CHART